Present Medical Data with Hexagonal Infographics
Product Description
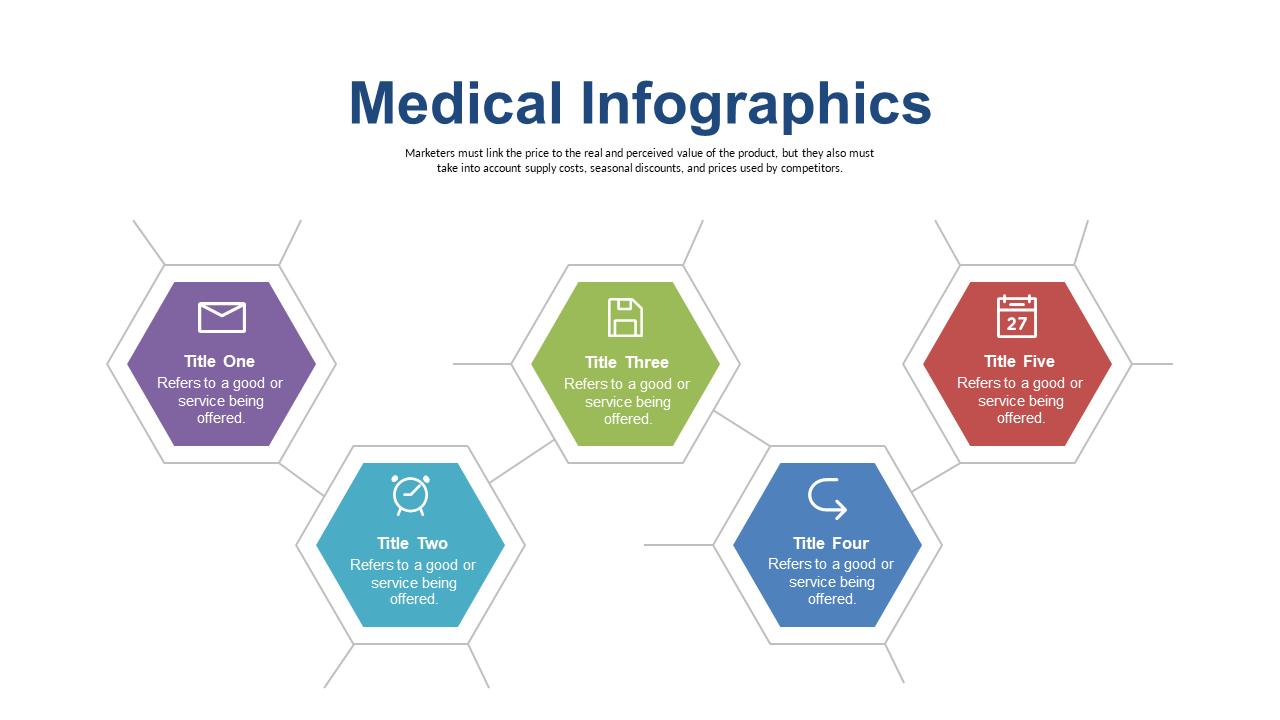
The challenge of presenting medical data often lies in making complex information understandable and engaging. With this vibrant hexagonal infographic slide, you can highlight essential data points without sacrificing visual appeal.
It simplifies the presentation of intricate topics, allowing your audience to absorb the information easily. This slide is ideal for data analysts in clinical research, health communications specialists preparing reports, or consultants showcasing healthcare trends to clients. Use it in team briefings, grant proposals, or even public health workshops where clear communication is key to success.
For only $0.99, you’ll receive an instant download that is fully editable in PowerPoint and Google Slides. Customize it effortlessly to cater to your specific audience and get your message across with clarity.
$0.99 – Purchase Checkout
Added to cart







