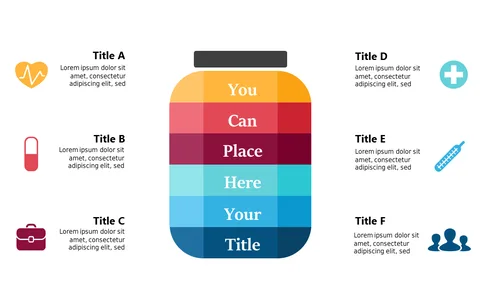
Healthcare Data Insights Presentation Layout

Product Description
Delivering critical data insights in the healthcare sector can sometimes feel overwhelming, especially when trying to make complex information accessible and engaging. This slide combines an anatomical illustration with a streamlined layout, allowing you to present vital insights clearly and attractively.
This layout works perfectly for healthcare professionals, medical researchers, or hospital administrators who need to present data at conferences, team meetings, or strategic planning sessions. Use it to showcase patient outcomes, medical research findings, or operational metrics to a diverse audience.
Available for just $0.99, this slide can be downloaded instantly. It’s fully editable in PowerPoint and Google Slides, making it easy to tailor your presentation in just a few minutes.
$0.99 – Purchase Checkout
Added to cart