Present Statistics with Circular Elements in Healthcare
Product Description
Communicating vital statistics in the healthcare field can feel overwhelming, especially when you’re trying to capture the attention of your audience. Complex data can easily become lost in dense text and unappealing visuals.
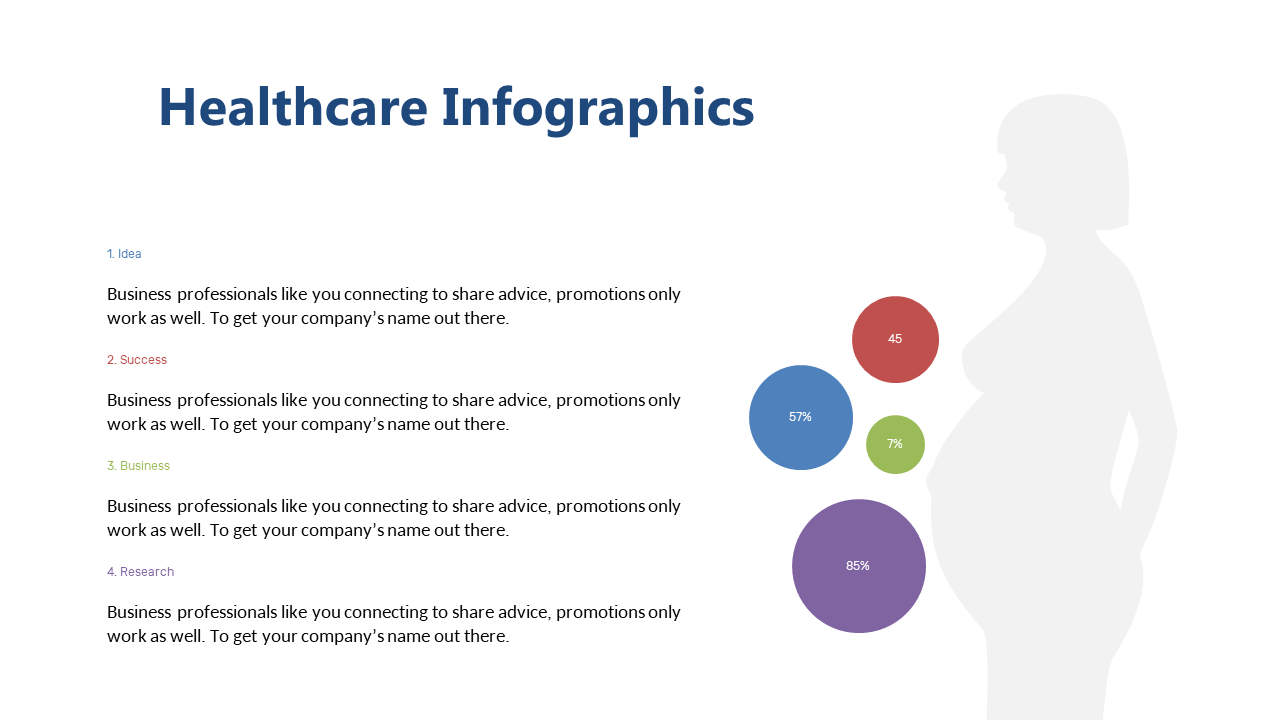
This slide transforms those figures into circular graphical elements, making your key data not just visible but engaging. Ideal for healthcare analysts presenting data trends, project managers summarizing outcomes, or even clinicians sharing patient statistics during team meetings, this slide helps you convey important information clearly. Whether you’re in a boardroom or a training session, you’ll be able to engage your audience and ensure they grasp the essential points.
For just $0.99, you can download this slide, which is fully editable in both PowerPoint and Google Slides. Get started in minutes by customizing it to fit your specific needs.
$0.99 – Purchase Checkout
Added to cart







