Visualize Collaboration with Handshake Infographic
Product Description
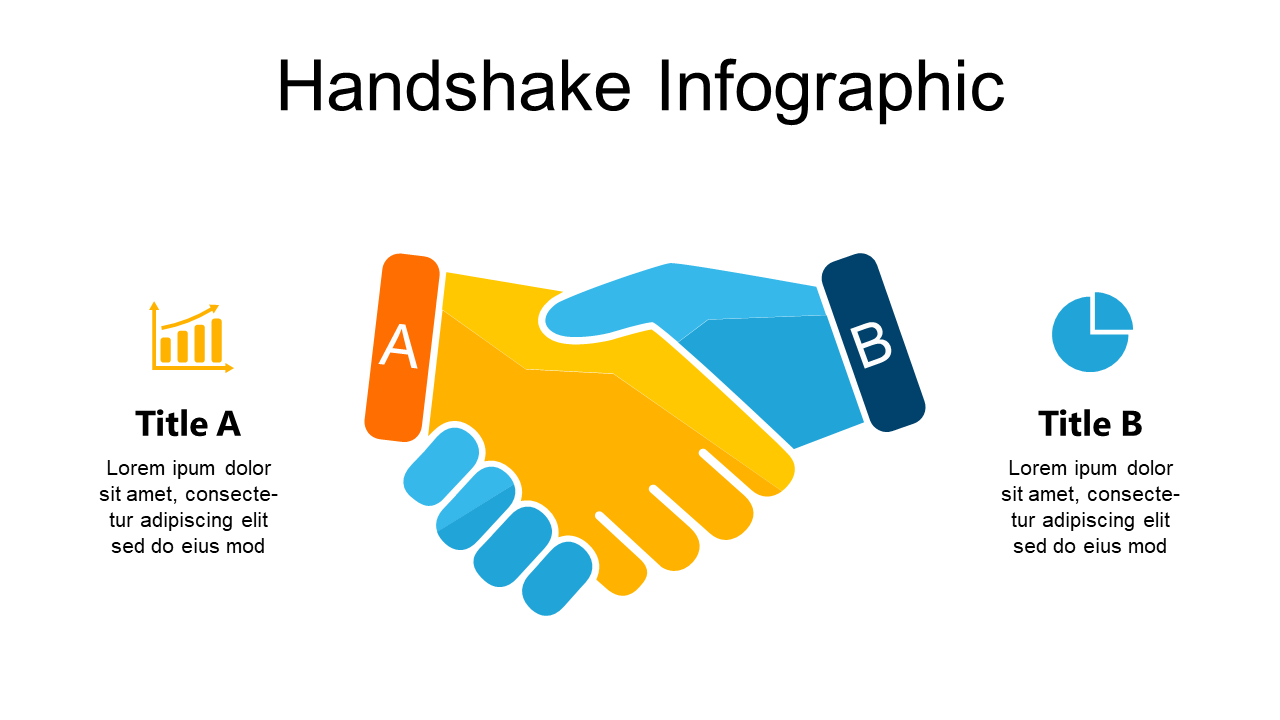
Collaboration can often feel abstract, making it tough to communicate its real impact on your team and projects. This infographic helps you present partnership outcomes clearly, using visual elements that resonate with your audience.
You can easily customize the text and colors to fit your specific message.
Consider this slide for roles like project managers in tech companies or business analysts during quarterly reviews to showcase teamwork results. It’s also perfect for consultants outlining joint ventures in client presentations. The visuals help make data-driven decisions and collaborative efforts more concrete, ensuring your points hit home.
For just $0.99, you can download this slide instantly and start editing it right away in PowerPoint or Google Slides. Make it your own and watch how it transforms your next presentation.
$0.99 – Purchase Checkout
Added to cart







