Gantt Chart for Task Coordination and Status Tracking
Product Description
Keeping track of numerous tasks can feel overwhelming, especially when you’re juggling deadlines and team responsibilities. It’s critical to visualize where each task stands and how they’re progressing.
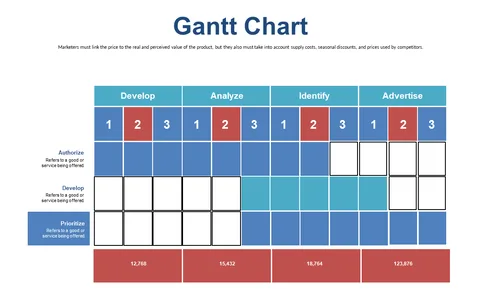
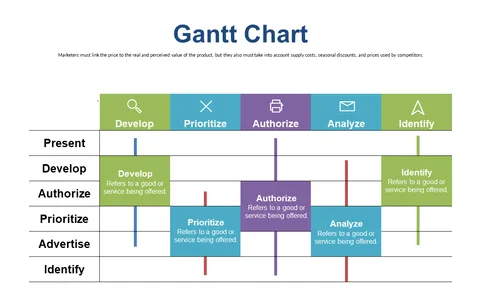
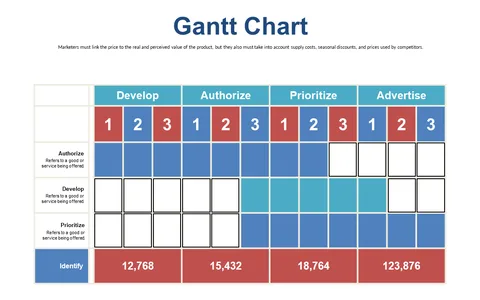
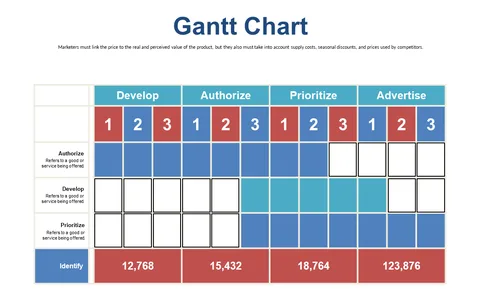
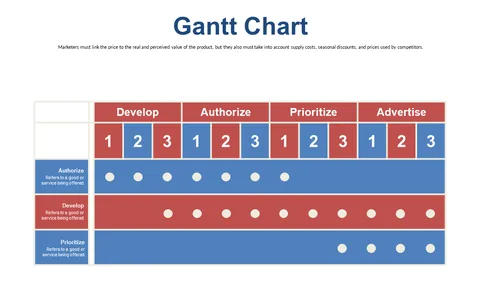
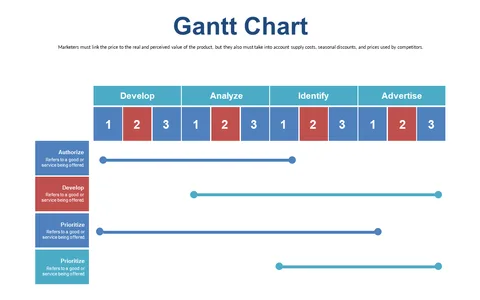
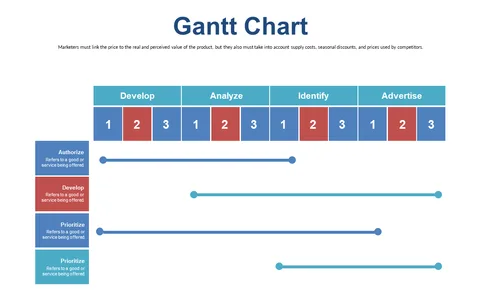
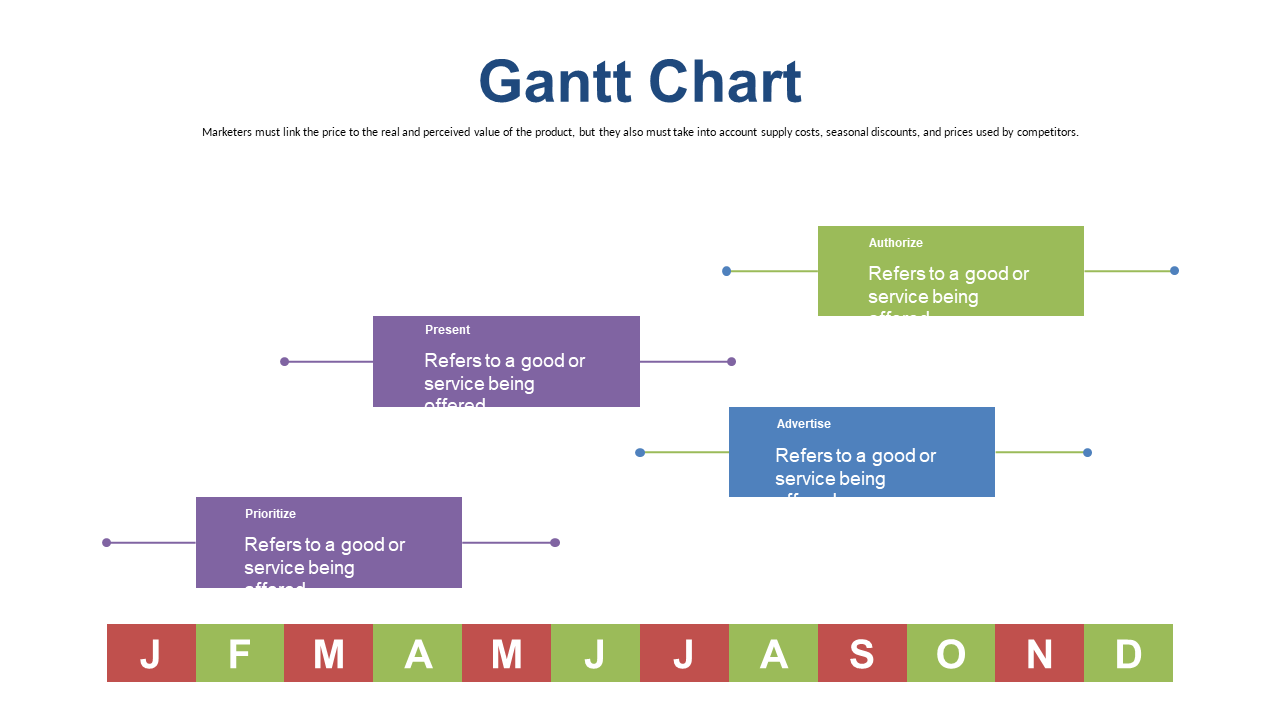
This Gantt Chart slide offers a clear representation of tasks alongside their timelines and authorization statuses, making it easy to coordinate efforts and identify potential delays. Perfect for team leads and program managers, this slide comes in handy during project check-ins or when you’re aligning cross-functional teams. Use it to facilitate discussions and ensure everyone knows their deliverables, while also tracking the project’s overall health.
For just $0.99, this Gantt Chart slide is ready for instant download and can be easily edited in PowerPoint or Google Slides. It takes only minutes to customize, allowing you to get back to what matters most—driving your project forward.
$0.99 – Purchase Checkout
Added to cart