Engage Audience with Five-Step Infographic Style
Product Description
Capturing your audience’s attention in a presentation can be tough, especially when information overload is a common issue. An engaging format is essential to keep your listeners focused and ensure they absorb your message.
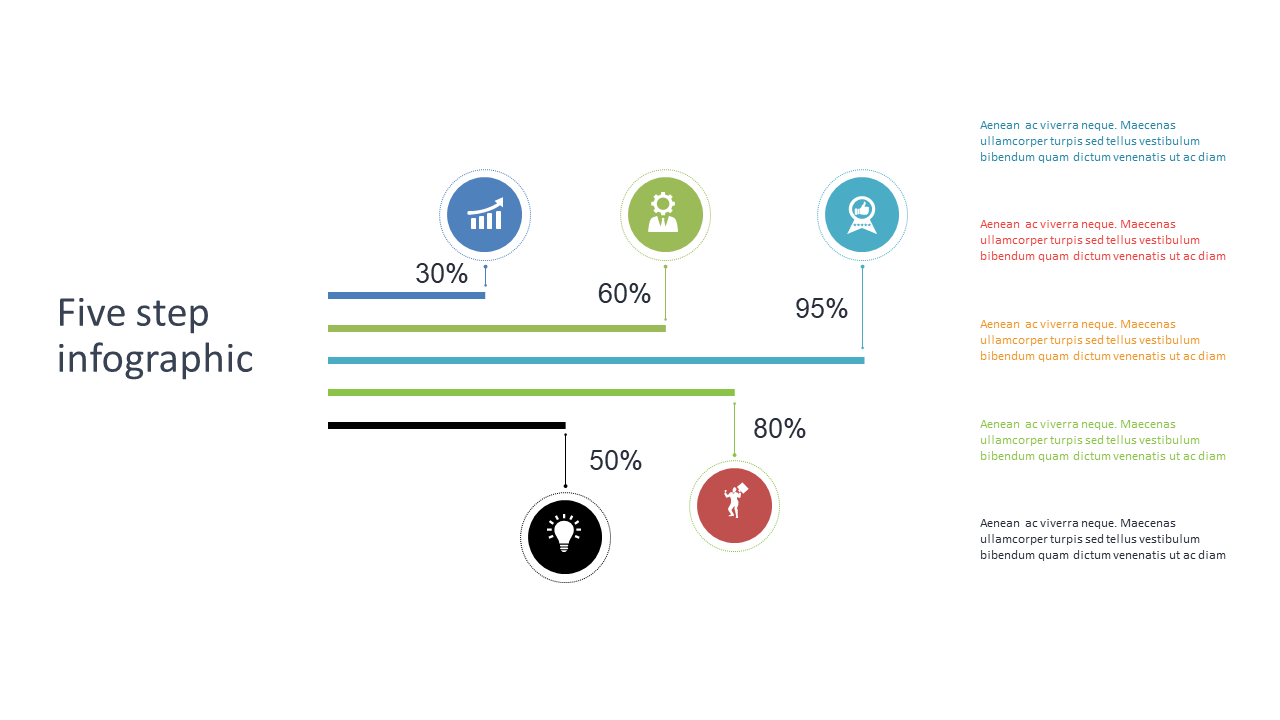
This five-step infographic design incorporates percentage indicators, making it a dynamic way to present significant information. Marketing professionals, educators, and team leaders can find this slide particularly useful when discussing processes, project timelines, or performance metrics. It fits perfectly in training sessions, workshops, or project updates where engagement is key to success.
For only $0.99, you can download this slide right now and customize it quickly in PowerPoint or Google Slides. It’s easy to edit, allowing you to adapt it to your specific presentation within minutes.
$0.99 – Purchase Checkout
Added to cart







