Focus on Financial Topics with Central Character Layout

Product Description
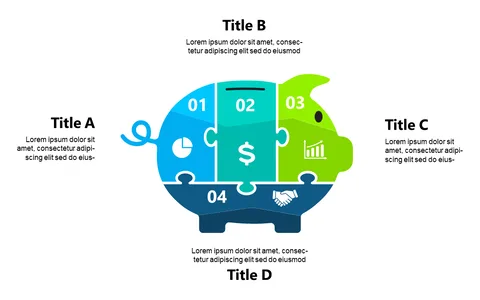
Navigating financial discussions can often lead to confusion when the focus is on numbers and metrics. This slide presents a central character surrounded by key financial icons, making it easier for your audience to engage with the essential concepts that drive your message home.
Finance professionals and budget planners will appreciate this slide during fiscal planning meetings or budget presentations. It’s ideal for scenarios where clarity in financial topics is crucial, helping you communicate effectively without overwhelming your audience.
For just $0.99, this slide is ready for instant download and can be edited in both PowerPoint and Google Slides. You can easily modify it to fit your specific content, ensuring you convey your financial insights with confidence within minutes.
$0.99 – Purchase Checkout
Added to cart