Present Environmental Data with Faucet Infographic
Product Description
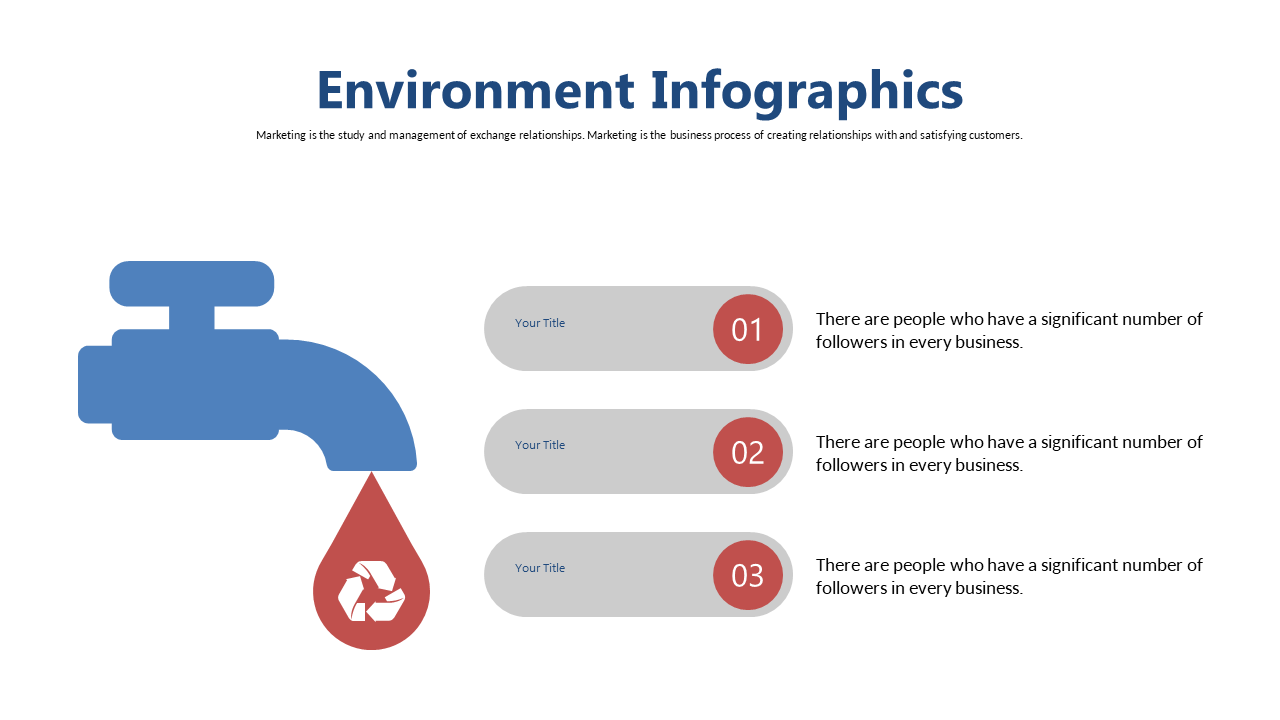
When you have a lot of environmental data to share, presenting it in an engaging way is essential to keep your audience’s attention. This faucet infographic slide helps transform dense statistics into a clear, striking visual that highlights the importance of sustainability in your message.
Environmental scientists, project managers, and educators can find this slide useful for workshops, seminars, or reports where clarity in data presentation is key. Use it to showcase water usage statistics, conservation efforts, or any relevant data that needs a compelling visual touch.
For only $0.99, you can download this slide and edit it effortlessly in PowerPoint or Google Slides. Get it ready in no time to create an engaging presentation that effectively communicates your data.
$0.99 – Purchase Checkout
Added to cart







