Ecosystem Infographic with Progress Indicators
Product Description
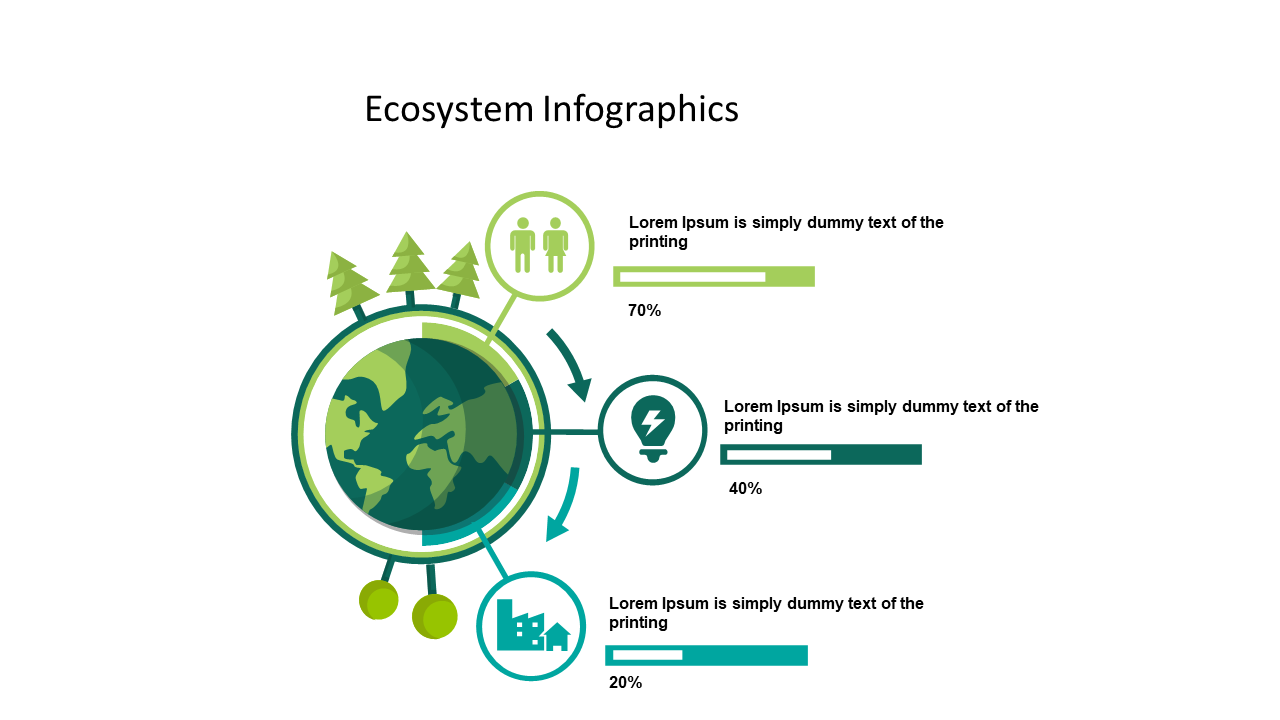
In workplace presentations, the challenge of making data clear and digestible is more important than ever. This ecosystem infographic, complete with progress indicators, helps you visually communicate your key statistics, ensuring your audience follows along without feeling overwhelmed.
Ideal for data analysts, sustainability consultants, and project managers in environmental fields, this slide shines in various settings. Use it in quarterly reports, strategy sessions, or educational presentations to deliver complex information in a straightforward manner that keeps your audience engaged.
With a price of just $0.99, you can quickly download this slide and
easily customize it in PowerPoint or Google Slides for your specific needs. Don’t let your data get lost in the details—make it eye-catching and clear with this infographic.
$0.99 – Purchase Checkout
Added to cart







