Present Environmental Data with Globe and Recycling Icons
Product Description
Struggling to present complex environmental data in an engaging manner? This slide can help you convey important statistics and insights visually, making your message much clearer.
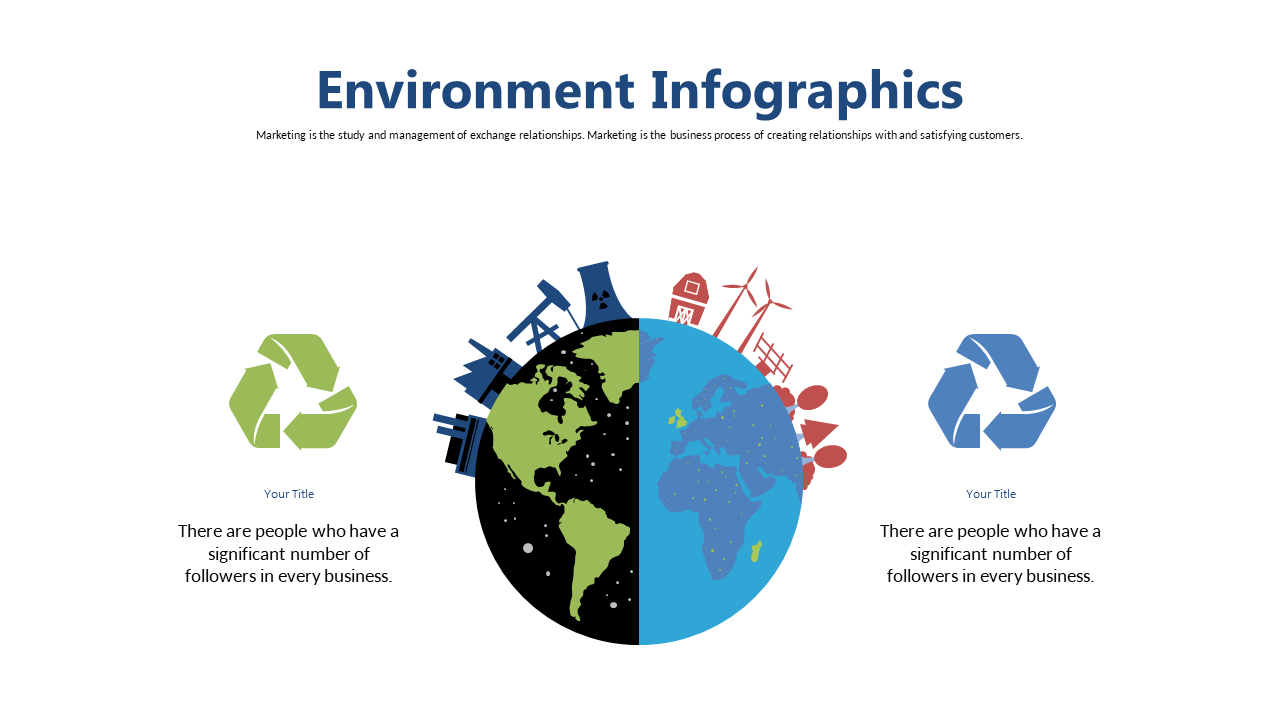
With its central globe illustration surrounded by recycling icons, it captures attention and emphasizes your points effectively. Content strategists, environmental analysts, and corporate trainers can utilize this slide for meetings, workshops, or reports focused on environmental issues. It’s perfect for simplifying complex data, making it accessible and relatable to your audience.
For just $0.99, you can download this slide instantly and customize it in both PowerPoint and Google Slides. Get it ready in minutes and deliver a professional presentation that clearly communicates your insights.
$0.99 – Purchase Checkout
Added to cart







