Visualize E-Learning Demographics Effectively
Product Description
Communicating the intricacies of e-learning demographics can feel like a daunting task, especially when you’re dealing with numerous data points. You need a way to simplify complex information so your audience can quickly understand the key insights.
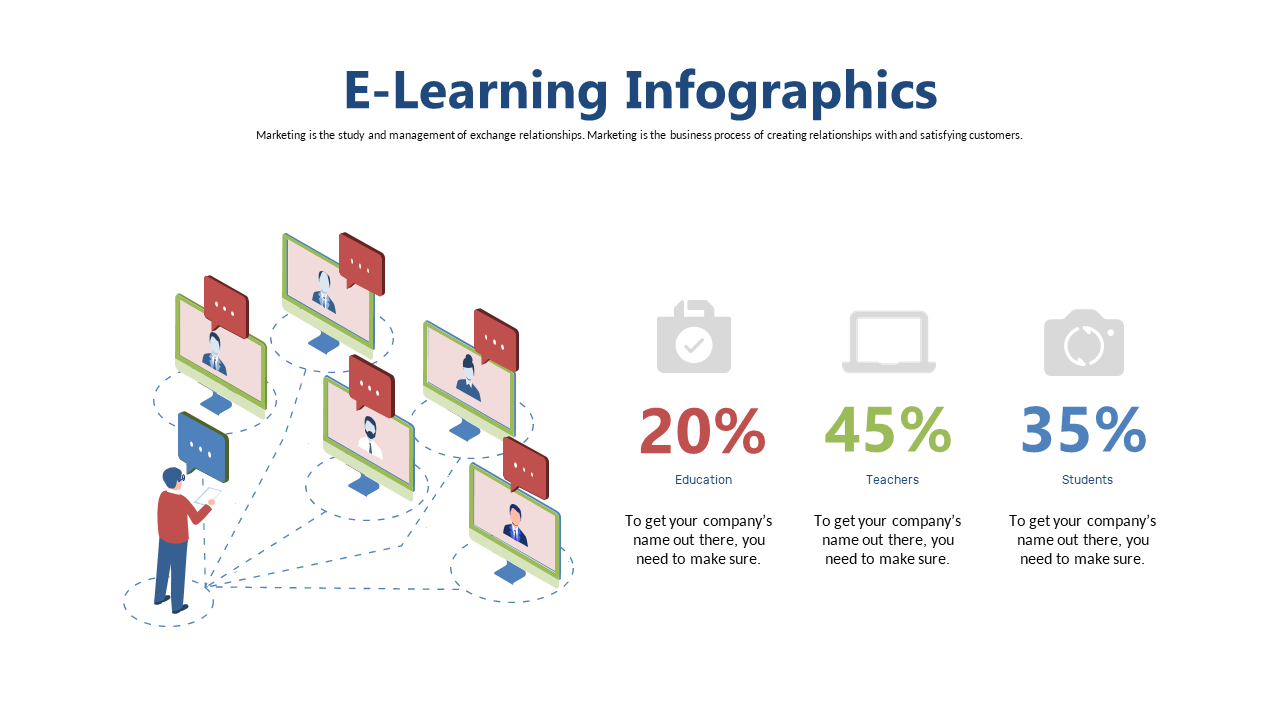
This infographic slide is designed to clarify e-learning demographics, combining visuals that resonate with your viewers. Use this slide when you’re a marketing manager analyzing trends or a curriculum developer presenting statistics at educational forums. Whether you’re discussing student engagement rates or teacher performance metrics, this slide helps translate those figures into a clear visual narrative that your audience can easily grasp.
For only $0.99, you can download this slide that’s ready to go and simple to edit in both PowerPoint and Google Slides. Make data-driven presentations a lot easier and more engaging in just minutes!
$0.99 – Purchase Checkout
Added to cart







