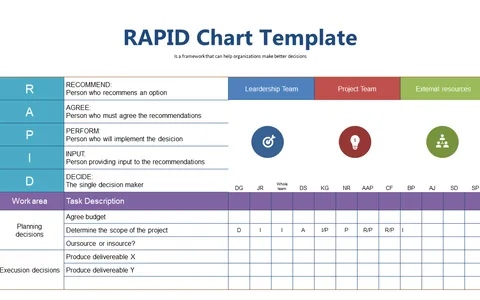
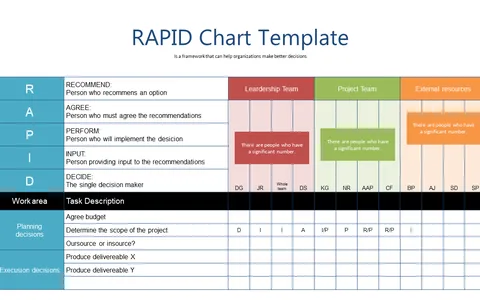
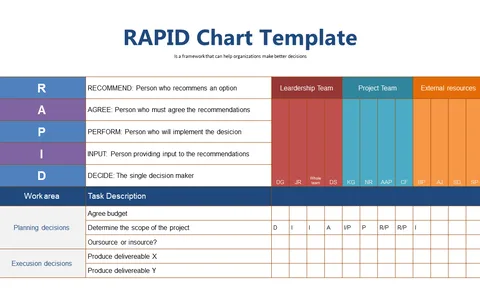
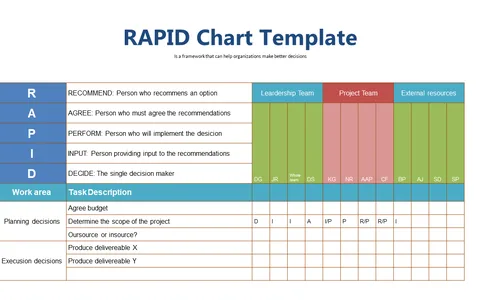
Differentiate Decision Options with Dual Path Flow

Product Description
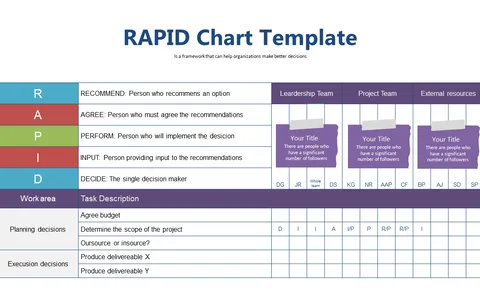
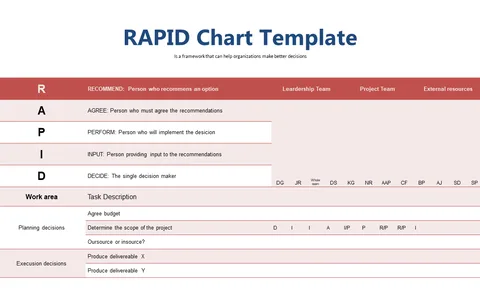
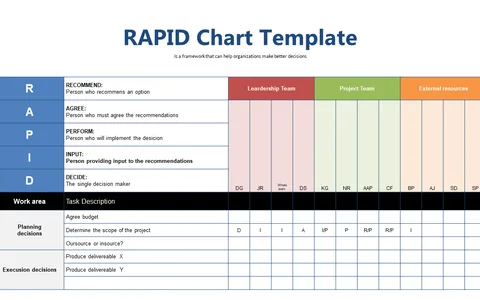
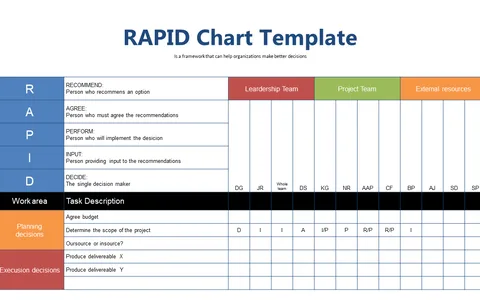
Complex decisions often leave teams feeling overwhelmed and unclear about their options. This slide simplifies that process by visually distinguishing two paths, making it easier for everyone to see the potential outcomes and make informed choices.
You might find this slide particularly useful as a project manager presenting options during strategy sessions, or as a team leader navigating critical choices in tech and finance. It can also serve well for consultants guiding clients through decision-making processes where clarity is vital.
For just $0.99, you can download this slide instantly and start editing it right away in PowerPoint or Google Slides. It’s designed for quick customization, so you can focus on your message without wasting time on design.
$0.99 – Purchase Checkout
Added to cart