Represent Complex Data with DNA Infographic
Product Description
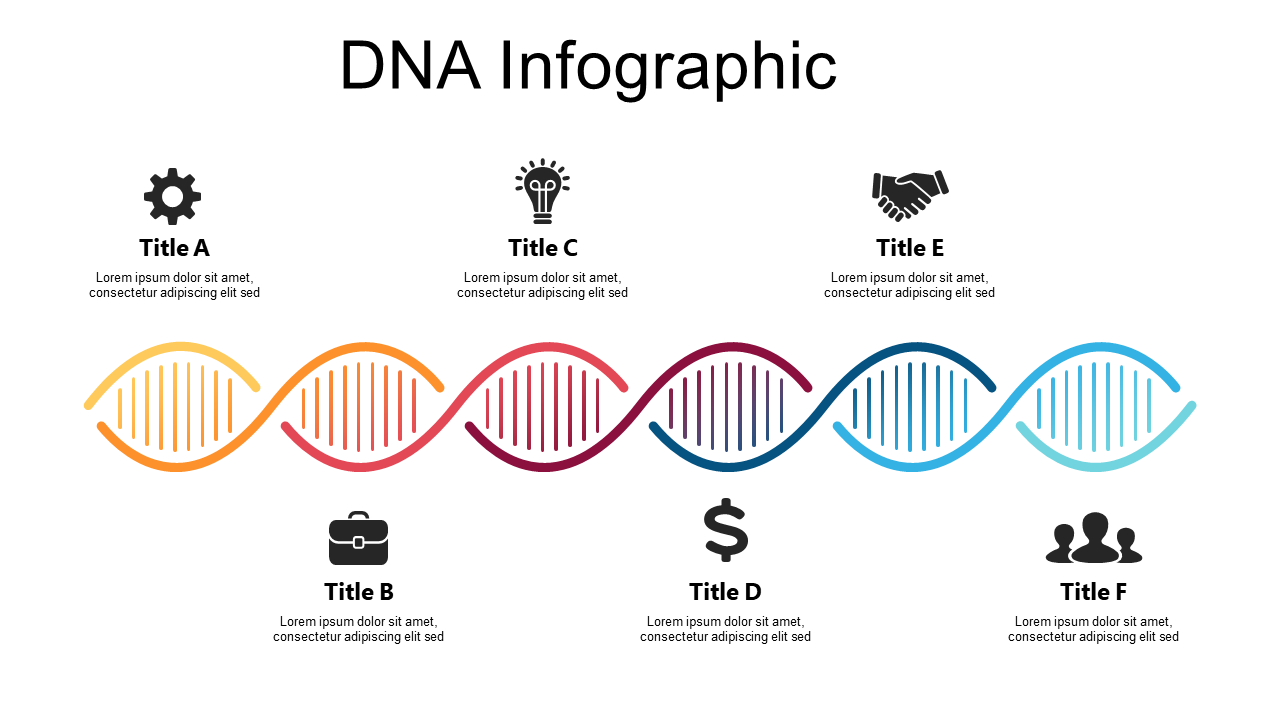
Understanding complex data can be a real challenge, especially when you need to explain intricate concepts clearly to your audience. The DNA infographic is designed to simplify this process, breaking down complex information into easily digestible sections that represent your data visually.
It’s perfect for those moments when clarity is crucial. This slide suits a variety of professionals, including business analysts presenting quarterly reports, educators developing lesson plans on genetics, or healthcare professionals explaining research findings. Whether you’re in a boardroom meeting or a classroom, this infographic will help you convey your message powerfully yet simply.
For just $0.99, you can download this slide and start editing right away. It’s fully customizable in both PowerPoint and Google Slides, allowing you to tailor it to your specific content in minutes.
$0.99 – Purchase Checkout
Added to cart







