Show Disability Awareness Statistics Effectively
Product Description
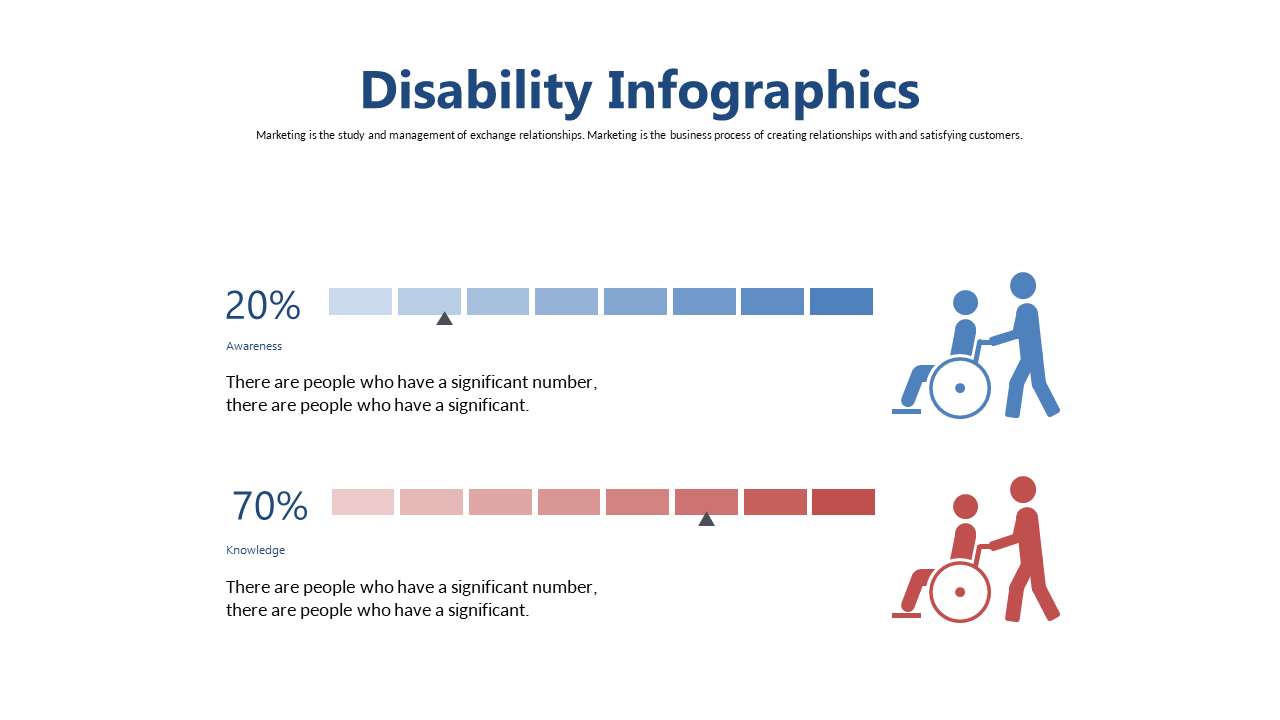
Presenting disability awareness statistics can be overwhelming, especially when trying to convey the importance of these numbers. It’s critical to make this data not just readable, but engaging, to foster understanding and awareness. This infographic is designed to capture attention and clarify the message behind the statistics.
Content creators and trainers can use this slide during workshops or presentations aimed at promoting disability awareness in corporate settings. Nonprofit organizations running community outreach programs will also find it invaluable for campaigns that aim to educate the public on these critical issues. This slide will help you ensure that your audience leaves with a clearer understanding of the relevant statistics.
For just $0.99, you’ll get an instant download that’s easy to edit in both PowerPoint and Google Slides.
You can customize it to fit your branding and messaging, allowing you to present important statistics in minutes.
$0.99 – Purchase Checkout
Added to cart







