Present Digital Marketing Insights with Growth Chart
Product Description
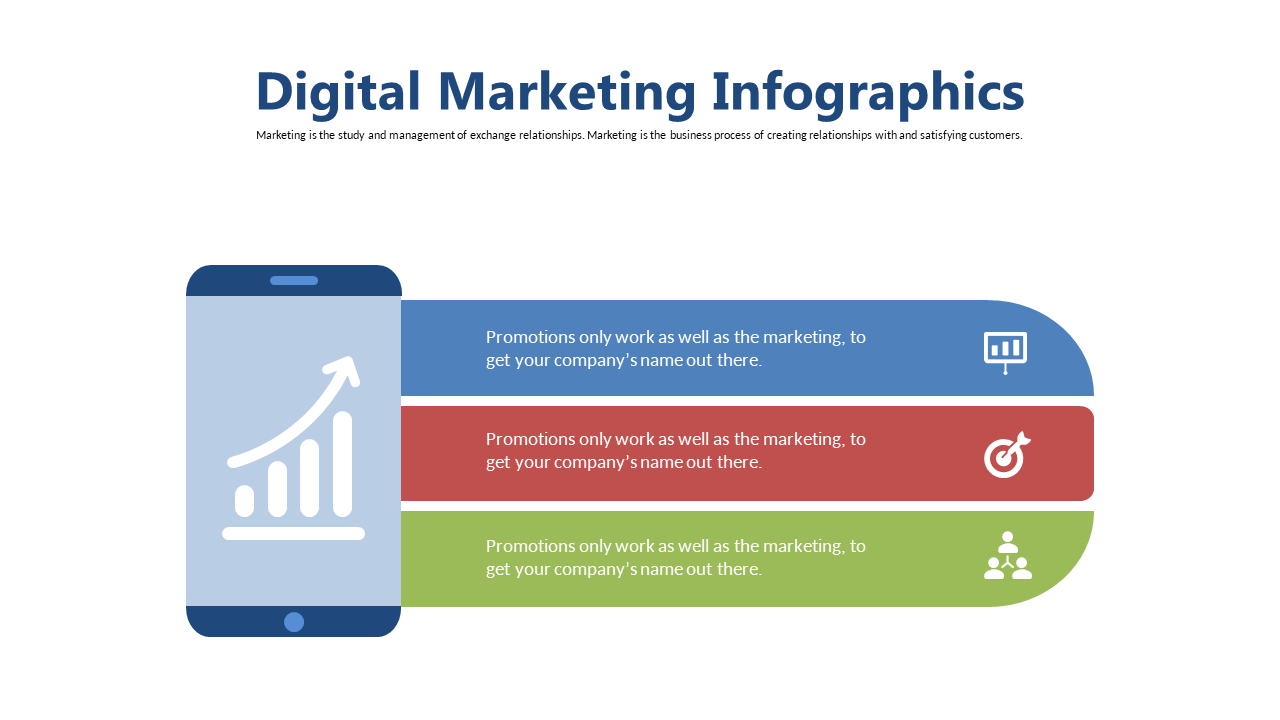
In the ever-evolving landscape of digital marketing, presenting insights effectively can be a daunting task. This slide offers a clear growth chart alongside a smartphone graphic, making data presentation easier and more engaging.
It simplifies complex information, allowing your audience to grasp key insights quickly. This slide is ideal for data analysts, digital marketing specialists, and business development teams who need to present reports or insights during quarterly reviews, strategy meetings, or client presentations. With its visually compelling format, you can capture your audience’s attention and ensure they understand your findings.
At just $0.99, this slide is an instant download and can be edited easily in PowerPoint or Google Slides. You’ll be able to tailor it to fit your narrative perfectly, making it a quick addition to your presentation toolkit.
$0.99 – Purchase Checkout
Added to cart







