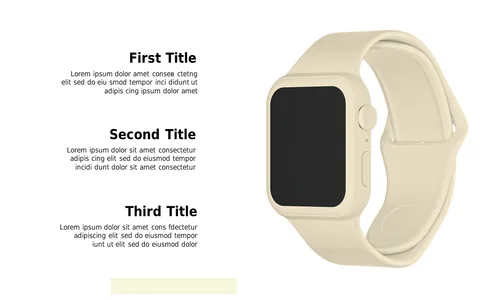
Present Growth Trends with Curved Wave Design

Product Description
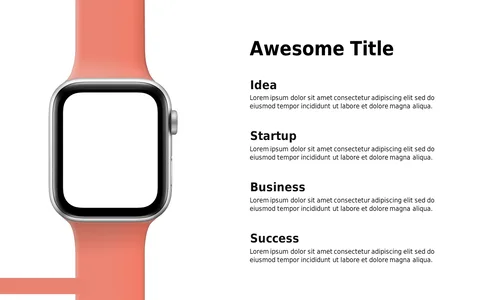
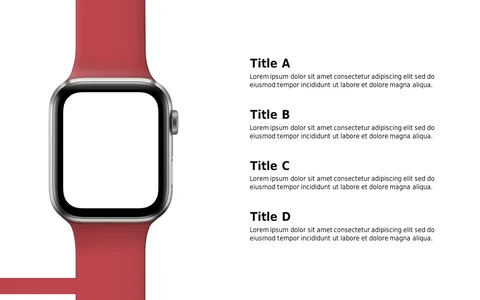
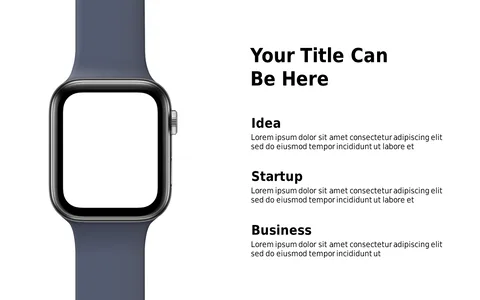
Presenting growth trends is essential for any business aiming to illustrate success, but boring layouts can dilute your message. This curved wave design not only highlights key data but also adds a creative touch to your presentation.
It captures attention and encourages your audience to visualize the narrative behind the numbers. Market analysts, product managers, and team leaders will find this layout especially useful during strategy discussions, quarterly reviews, or investor presentations. With its engaging design, you can effectively showcase growth trajectories or market dynamics, making your insights compelling and memorable.
For just $0.99, this slide is available for instant download and is fully customizable in PowerPoint and Google Slides. You can quickly tailor it to match your branding and adjust the content to fit your specific data story, giving you a polished presentation in minutes.
$0.99 – Purchase Checkout
Added to cart