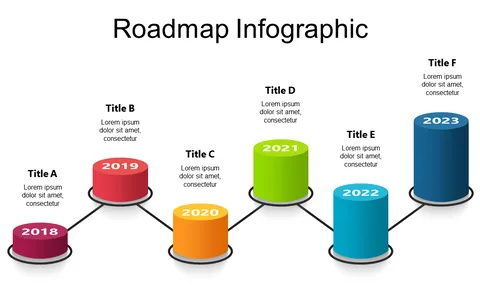
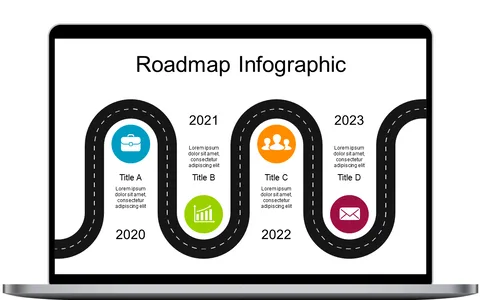
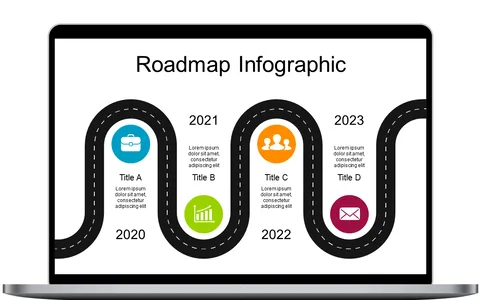
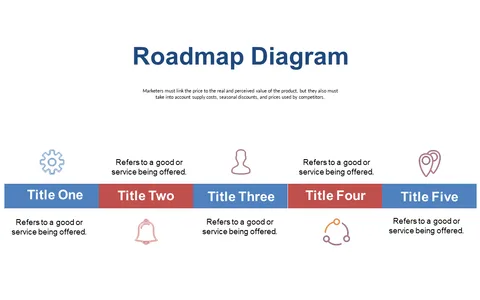
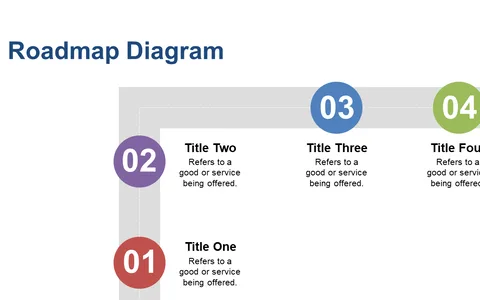
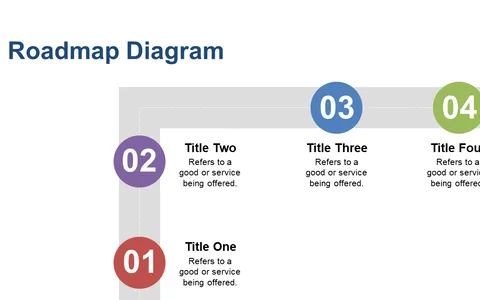
Showcase Project Stages with Curved Roadmap Diagram

Product Description
Communicating the progress of a project can often feel overwhelming, especially when dealing with multiple stages and details. A clear visual tool can simplify this process, making it easier to communicate each phase effectively. This curved roadmap diagram is designed to visually represent project stages, ensuring clarity for your audience.
Project managers, program directors, and consultants will find this slide particularly useful during updates, client briefings, or progress reports. It serves as an excellent way to outline the project’s journey and make sure all team members and stakeholders understand where things stand.
The engaging design captures attention and enhances comprehension. For just $0.99, you can easily download this slide and edit it in PowerPoint or Google Slides. It’s ready for you to customize and use in minutes, helping you communicate your project stages with confidence.
$0.99 – Purchase Checkout
Added to cart