Compare COVID-19 Vaccines with Key Metrics
Product Description
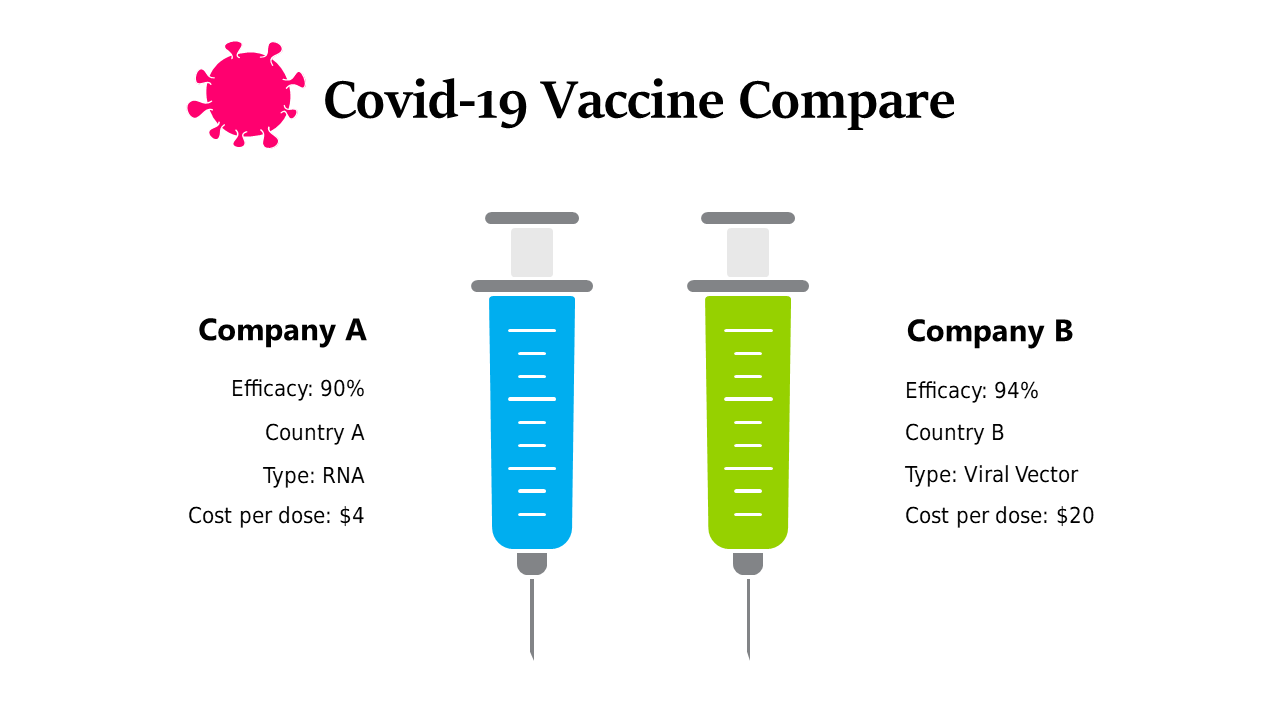
When comparing COVID-19 vaccines, it’s crucial to present the information clearly and concisely to help your audience make informed decisions. This infographic layout simplifies that task by allowing you to visually compare key metrics, ensuring your essential points are highlighted effectively.
It’s an excellent resource for making complex data more digestible. Healthcare professionals, educators, and policymakers can make great use of this template during meetings, educational sessions, or public presentations. Whether you’re discussing vaccine options in a health department meeting or presenting to community groups, this slide enhances your ability to convey critical vaccine information with clarity.
For just $0.99, you can download this infographic slide instantly and customize it easily in PowerPoint or Google Slides. Tailor it to your specific data and ensure your audience walks away informed and empowered within minutes.
$0.99 – Purchase Checkout
Added to cart







