Engaging COVID-19 Vaccine Comparison Layout
Product Description
In today’s information overload, the challenge of presenting data clearly has never been more pressing. Many audiences struggle to grasp essential insights when faced with dense text and numbers, especially regarding critical topics like vaccines.
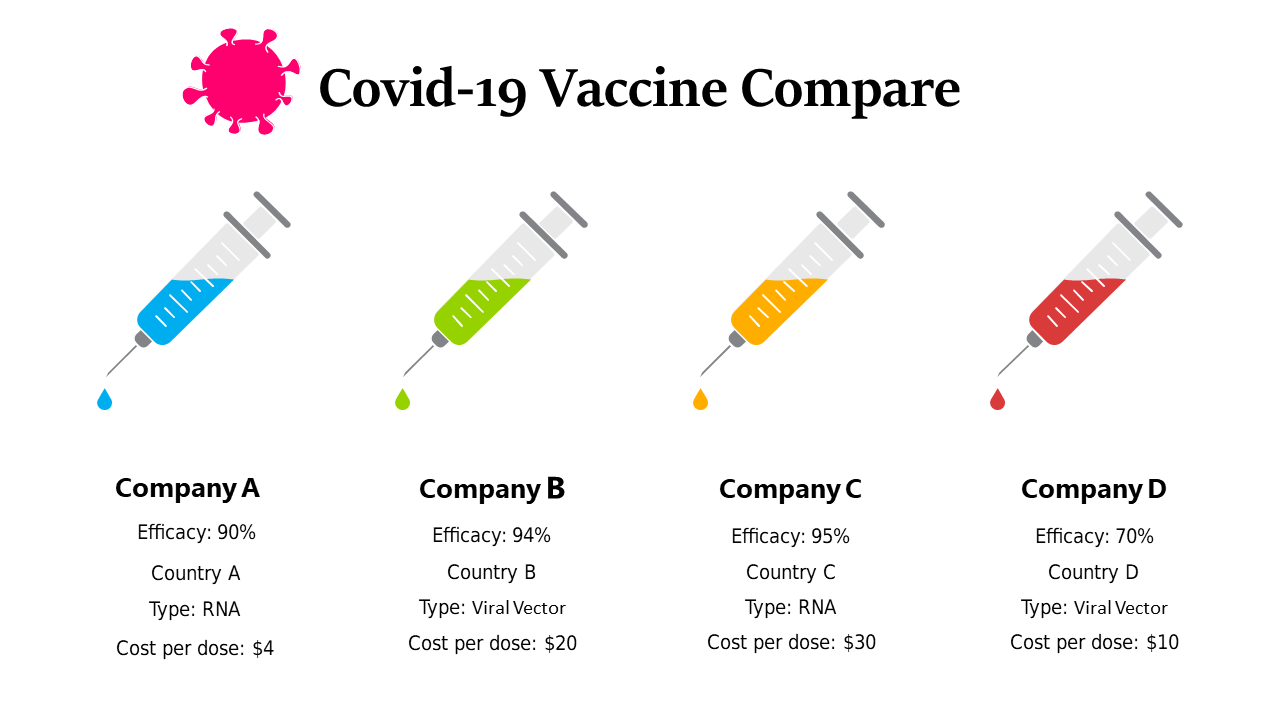
This slide gives you an engaging method to visualize comparison data that is crucial for informed decision-making. You might find this layout useful in settings like briefings with healthcare teams or community outreach programs discussing vaccine options. Public health officials can utilize it to make compelling presentations at town hall meetings or even in marketing efforts to help clarify the differences for potential patients.
Available for just $0.99, this slide can be downloaded instantly and is fully editable in PowerPoint and Google Slides. You can easily modify the content to meet your specific needs, allowing you to create an impactful presentation in just minutes.
$0.99 – Purchase Checkout
Added to cart







