Illustrate User Behavior with Comparison Charts
Product Description
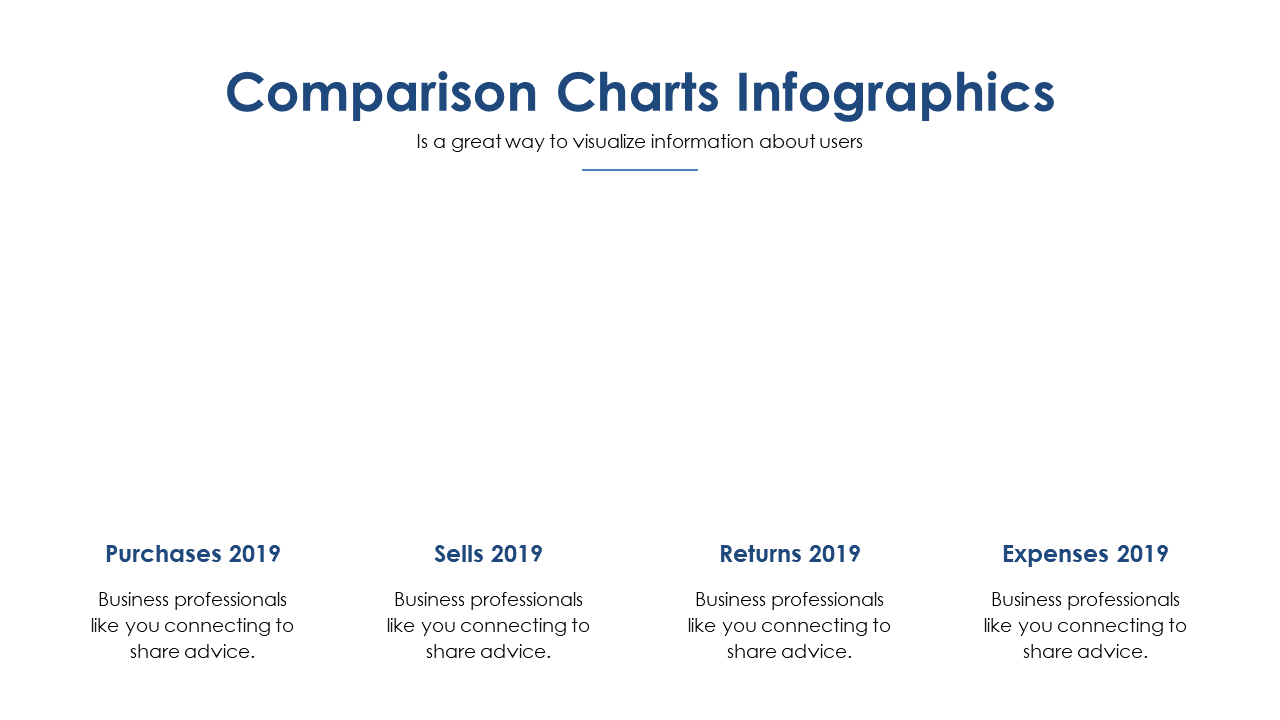
Understanding user behavior is critical, yet conveying insightful data can often be a daunting task. This slide features comparison charts that make it easy to present trends and patterns in user actions concisely.
The organized layout allows you to highlight key insights at a glance, ensuring your audience stays engaged. Data analysts, user experience researchers, and marketing teams can utilize this slide during reports, team briefings, or strategy discussions to effectively communicate user behavior insights. It serves as a fantastic resource when you need to illustrate comparisons clearly in workshops or stakeholder meetings.
Available for just $0.99, this slide is ready for immediate download and can be edited in PowerPoint or Google Slides. Transform your data presentations with ease and clarity.
$0.99 – Purchase Checkout
Added to cart







