Visualize Brand Trends with Comparison Chart Infographics
Product Description
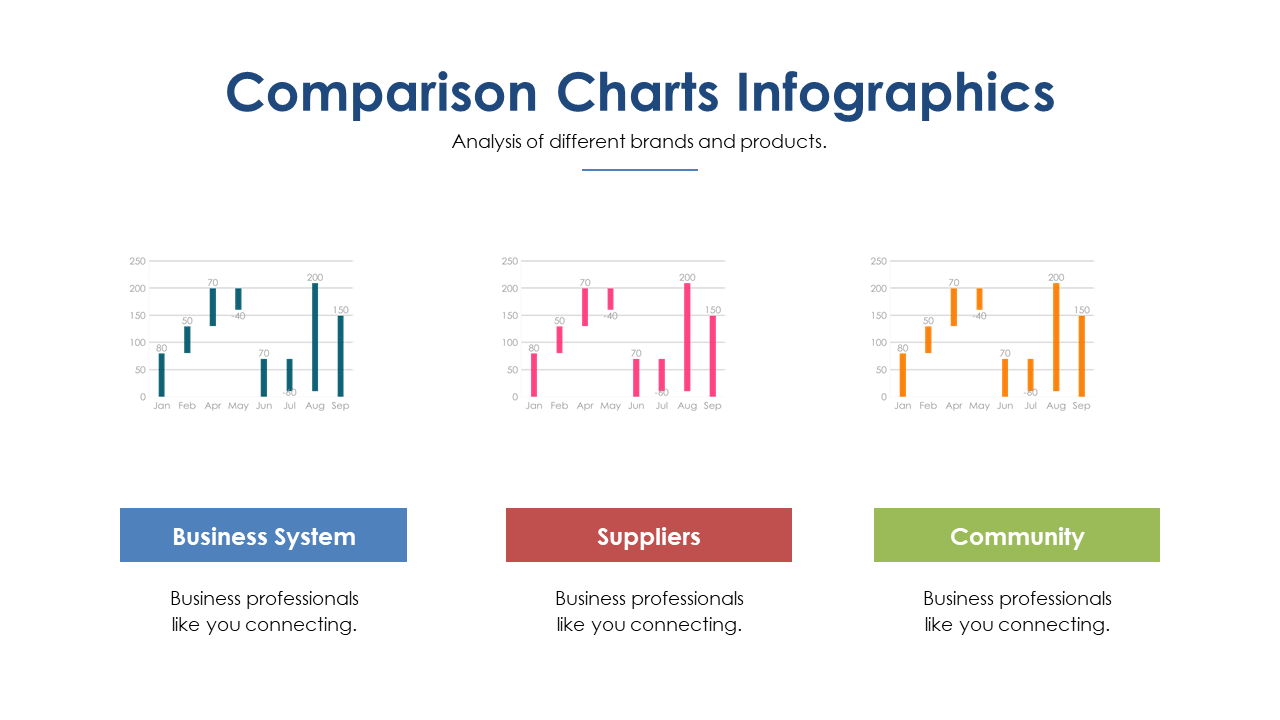
Communicating brand performance can feel overwhelming, especially when trying to make data relatable and engaging. This slide uses comparison charts to break down complex information, enabling you to showcase trends over time clearly and effectively. Your audience will appreciate the clarity it brings to brand analysis.
Whether you’re a marketing manager presenting quarterly performance metrics or a brand strategist at a review meeting, this slide fits seamlessly into your presentations. Use it to highlight how your brand stacks up against competitors or to show growth patterns to your team or clients.
It’s particularly useful in market research initiatives or brand development sessions. For just $0.99, you can instantly download this slide and start customizing it to fit your needs. It’s ready to go in both PowerPoint and Google Slides, making it easy to edit and adapt your data without any hassle.
$0.99 – Purchase Checkout
Added to cart







