Present SWOT Analysis with Colorful Infographic

Product Description
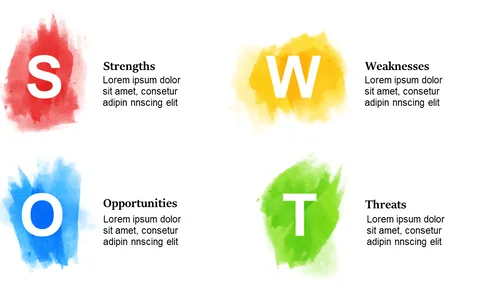
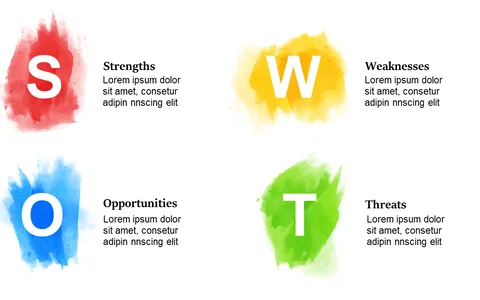
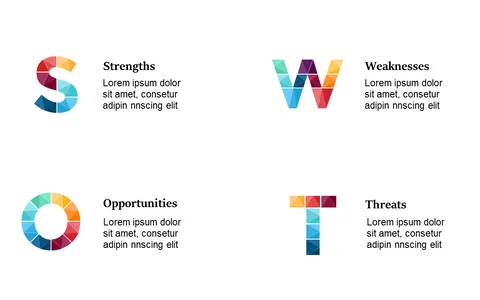
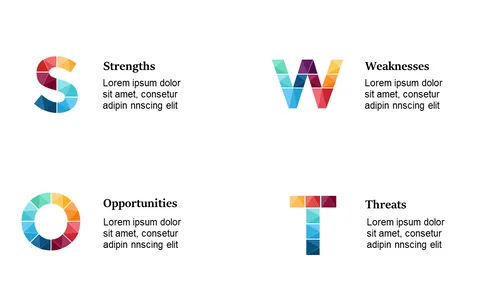
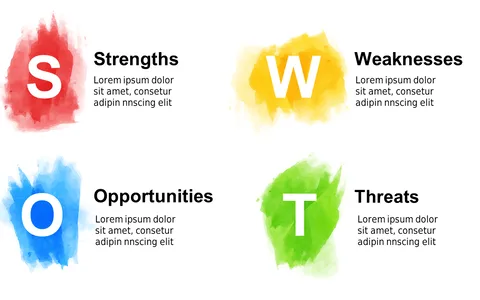
When you need to present a SWOT analysis on short notice, clarity is key. This colorful infographic slide simplifies the traditional SWOT format, neatly organizing information into four sections for strengths, weaknesses, opportunities, and threats.
It turns potentially overwhelming data into an engaging visual that captures attention. Best suited for strategic planners or marketing managers discussing competitive analysis during team meetings, this slide is crucial when you need to inform and inspire action. It’s perfect for any scenario where you need to analyze your business environment and share insights with your colleagues or clients.
For just $0.99, you can download this slide immediately and tailor it to your needs. It’s fully editable in both PowerPoint and Google Slides, ensuring you can have it ready for your presentation in no time.
$0.99 – Purchase Checkout
Added to cart