Convey Financial Ideas with Colorful Puzzle Dollar Sign
Product Description
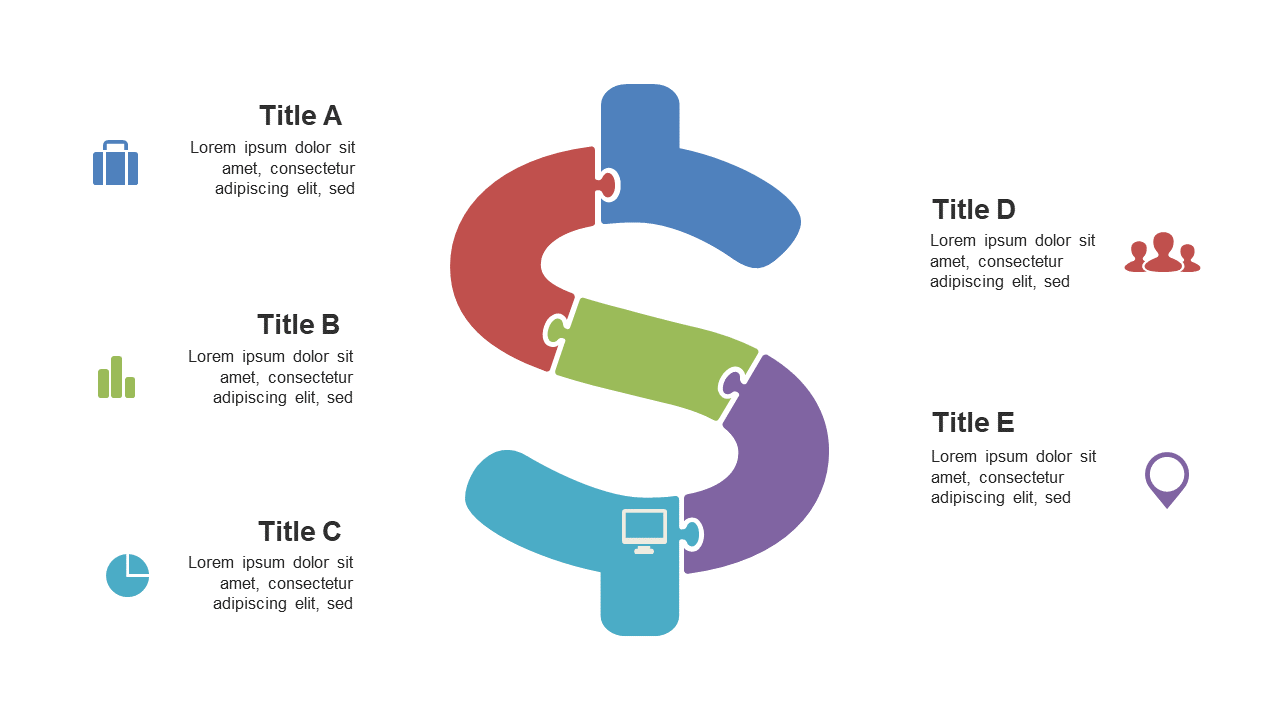
Translating financial concepts to your audience can often lead to confusion and disconnect. This slide simplifies the task with a colorful puzzle dollar sign, effectively breaking down complex ideas into engaging visual components.
Ideal for finance professionals presenting budget reports, investment analysts discussing portfolio diversifications, or educators teaching financial literacy, this slide helps demystify numbers and makes your points more relatable. Each puzzle piece can represent different financial topics, allowing for focused discussions.
For only $0.99, you can download this slide immediately and customize it quickly in both PowerPoint and Google Slides. It’s an easy way to make financial discussions more engaging and understandable.
$0.99 – Purchase Checkout
Added to cart







