Present COVID-19 Facts with Colorful Infographic
Product Description
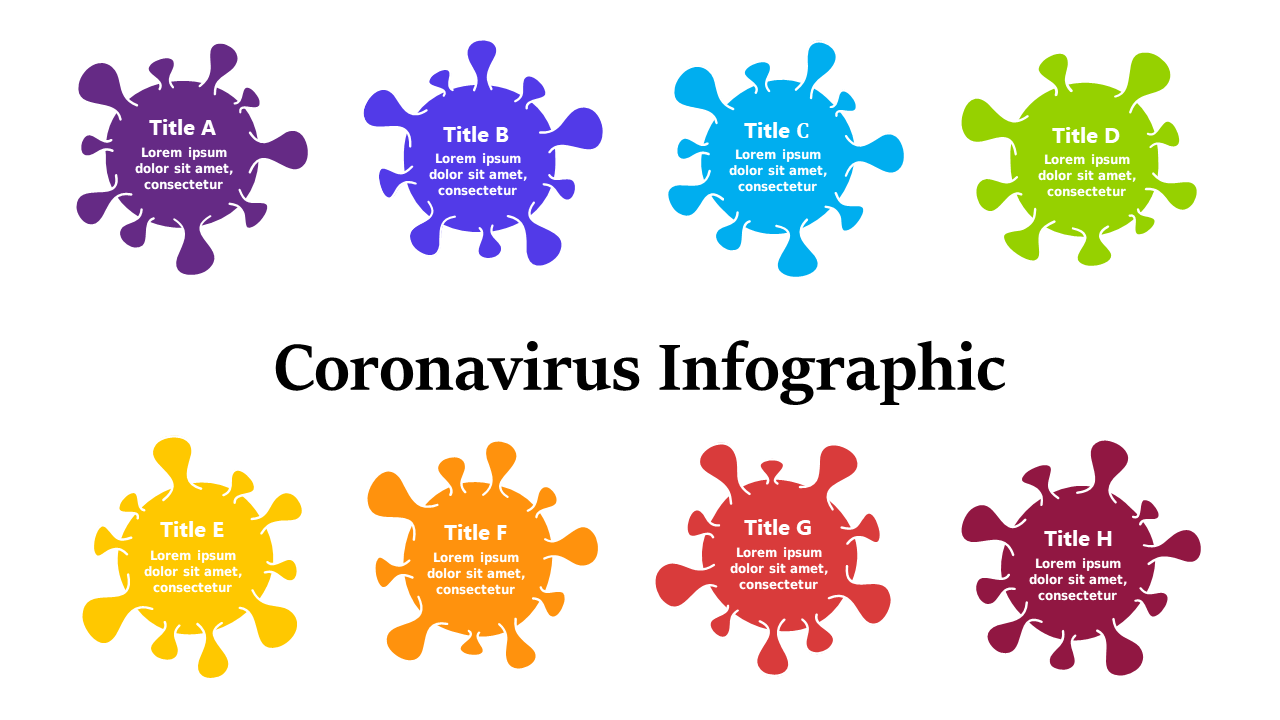
Communicating important facts about COVID-19 can be challenging when trying to keep your audience engaged. This colorful infographic layout captures attention while providing clear, essential information, allowing you to present data in a visually appealing way that’s easy to understand.
It’s the perfect tool for transforming complex details into digestible content. Health professionals, educators, and public speakers will find this infographic useful for a range of presentations, including public health campaigns, educational seminars, and community outreach programs. If you’re looking to inform or educate audiences about COVID-19, this slide can serve as a powerful visual aid that enhances understanding.
For just $0.99, you can instantly download this slide and adapt it to your needs. It’s fully editable in both PowerPoint and Google Slides, so you can tailor it in no time to ensure your presentation is both informative and engaging.
$0.99 – Purchase Checkout
Added to cart







