Engage with 8-Segment Circular Diagram for Presentations
Product Description
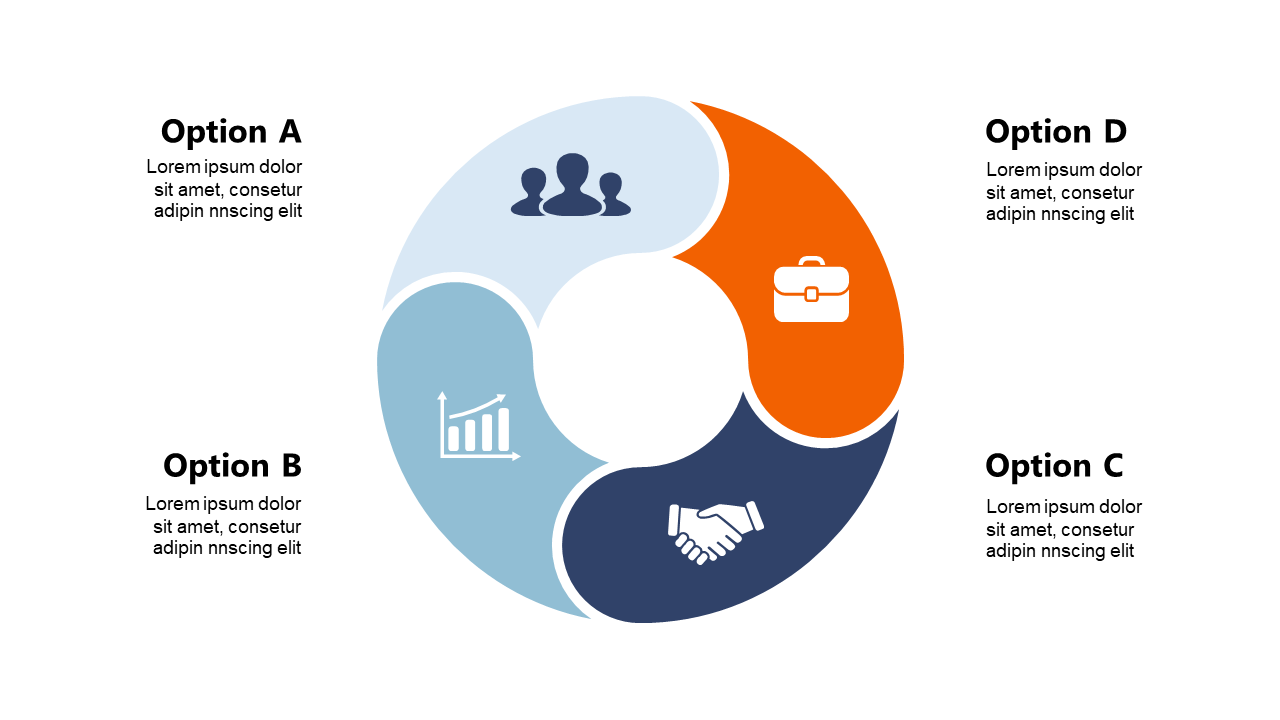
When you need to present multiple key points or categories without overwhelming your audience, a clear and colorful diagram can be a game-changer. A traditional list can easily become tedious, but this engaging 8-segment circular diagram grabs attention and makes information digestible.
This slide is perfect for marketing managers outlining campaign strategies, sales professionals showcasing product categories, or consultants presenting market research findings. It effectively communicates your message in team meetings, client presentations, or training sessions, ensuring everyone remains engaged and informed.
Download this visually appealing slide for just $0.99, and it’s ready for immediate use.
You can easily customize the icons and colors in PowerPoint or Google Slides to fit your brand’s style and message.
$0.99 – Purchase Checkout
Added to cart







