Visualize Processes with Diverging Paths
Product Description
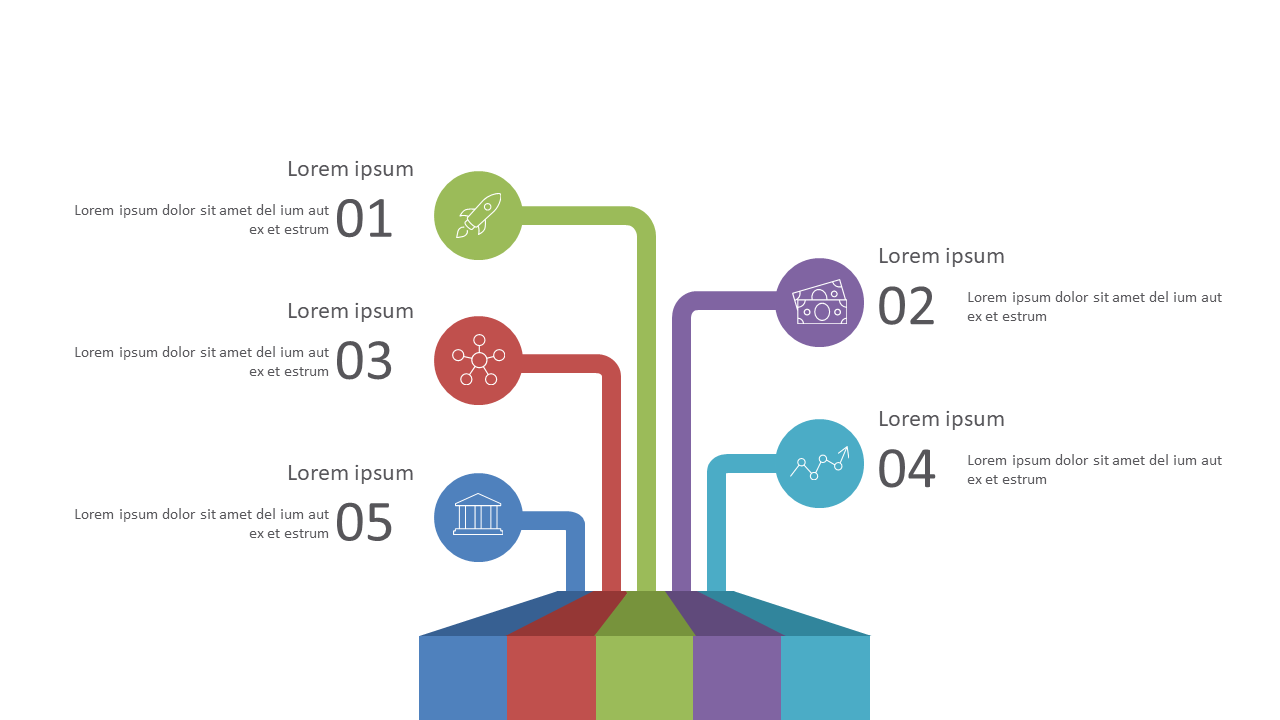
Presenting complex processes in a meeting can often feel overwhelming, especially when your audience struggles to grasp the intricacies. A well-designed infographic can clarify each step and show how different paths lead to distinct outcomes, making your message more impactful.
This slide is perfect for project managers mapping out various workflows, marketing teams presenting strategic options, or business analysts showcasing multiple solutions during stakeholder discussions. It brings clarity to discussions around product development strategies or operational processes, ensuring everyone stays on the same page.
For just $0.99, you can download this engaging slide instantly, and it’s ready to be customized in PowerPoint or Google Slides. Edit it easily to fit your specific needs and capture your audience’s attention in just minutes.
$0.99 – Purchase Checkout
Added to cart







