Present Data with Colorful Banner Text Boxes
Product Description
In fast-paced meetings, it’s easy for your message to get lost in a sea of numbers and data. Many presentations struggle to make information engaging, resulting in a disengaged audience.
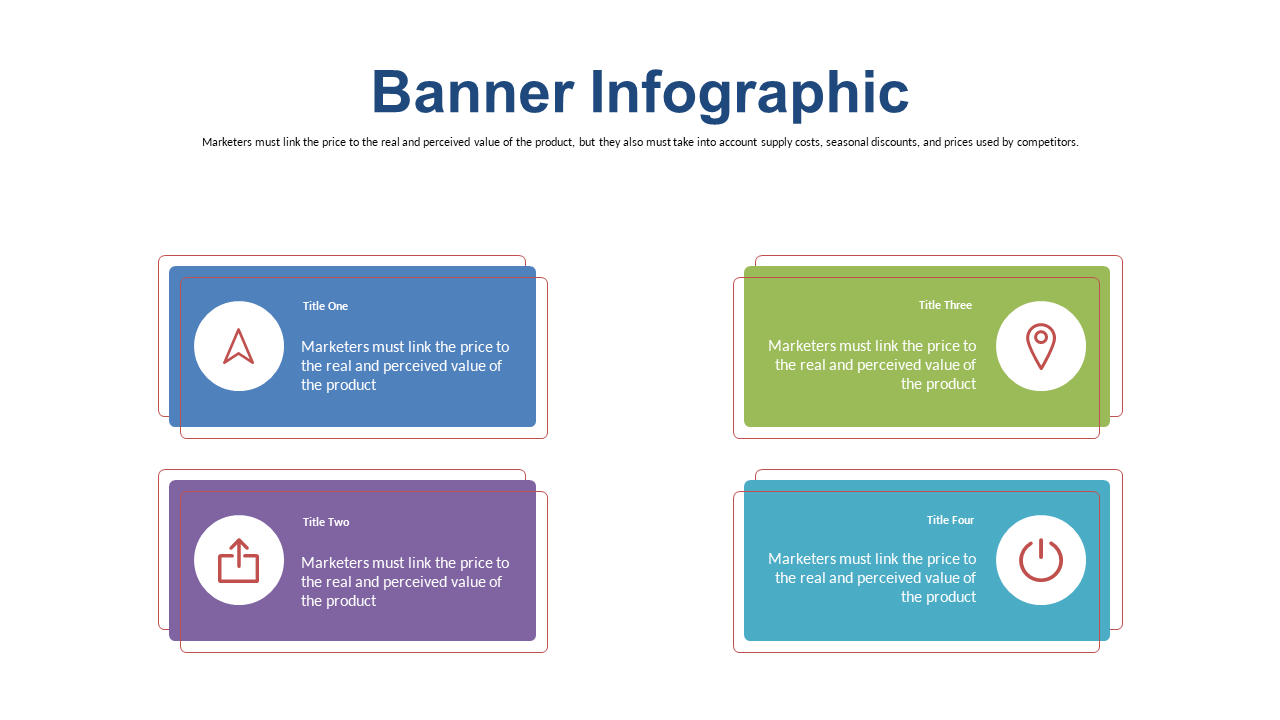
This slide brings your data to life with colorful banner text boxes, ensuring your key points really pop and capture attention. This slide fits perfectly for data analysts presenting findings, project managers summarizing project status, or sales teams showcasing performance metrics. Whether you’re leading a quarterly business review or discussing product performance, this slide helps keep your audience focused on what truly matters.
At just $0.99, this slide is ready for instant download and can be edited in PowerPoint and Google Slides. It’s designed for ease, so you can quickly input your data and have a professional-looking presentation ready in minutes.
$0.99 – Purchase Checkout
Added to cart







