✦ Slide Picker: Pick individual slides from 7,486+ designs — $0.99/slide. No subscription. Mix any category. Explore → | ✏ Edit Online After Purchase — No software needed
Home›Infographics›Compare Metrics with Brush Stroke Infographic

Compare Metrics with Brush Stroke Infographic

✨ Slide Library 🛡 7-Day Money-Back Guarantee ✏️ Edit in Slide Editor 🔒 Available after purchase PowerPoint Google Slides

Product Description

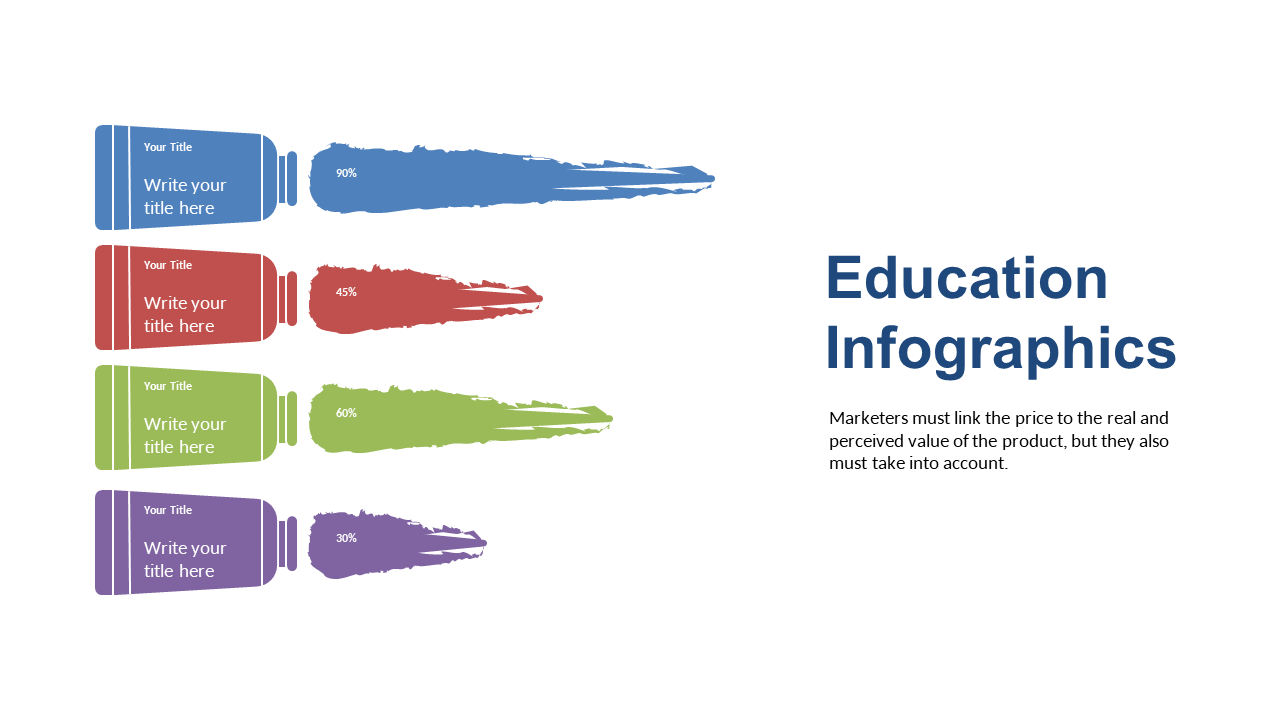
In a world overflowing with data, making complex metrics easy to understand is essential for engaging your audience. You might struggle with how to present those numbers effectively, but this brush stroke infographic provides a creative way to simplify even the most intricate information. The vibrant design not only enhances clarity but also keeps your audience’s attention focused.

Think about a financial analyst tasked with presenting quarterly results or a product manager comparing performance metrics during a team meeting. This slide serves as a fantastic tool to visualize important data points that might otherwise be overwhelming.

It’s also great for educators who are explaining detailed statistics or trends to their students. For just $0.99, you can download this slide and have it ready for editing in no time. It’s compatible with both PowerPoint and Google Slides, making it easy for you to tailor it to your specific requirements.

$0.99 – Purchase Checkout

Added to cart

✅ Instant delivery ✅ Fully editable ✅ PowerPoint & Google Slides
Category:
$0.99
Per slide · No minimum · Pay only for what you pick
Checkout →
✓ $0.99/slide No minimum order
✓ Mix any category No subscription
✨
Building a full deck?
Mix slides from any of our 58 categories — all merged into one PowerPoint. $0.99/slide, no minimum.
Browse All Slides →

More Infographics Slides

Add more from this category to your custom deck







