Visualize Data with Circular Progress Chart Infographic
Product Description
Presenting complex data can be tricky when clarity is your goal. Transforming raw numbers into a story that resonates with your audience is critical, and having the right visual tools can make all the difference.
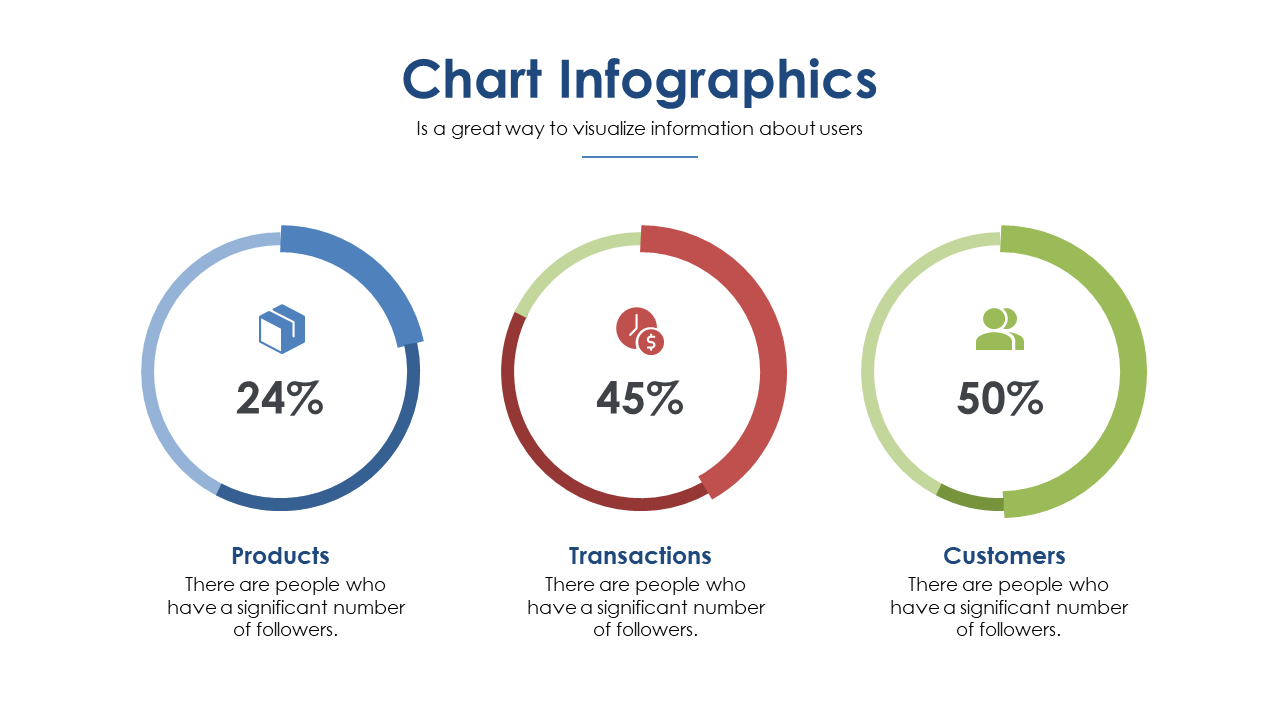
This circular progress chart infographic offers a visually engaging way to display percentage data, turning dry figures into understandable insights. Data analysts, marketing professionals, and sales managers can use this infographic in reports, pitches, or dashboard presentations. If you’re summarizing quarterly performance metrics or presenting survey results, this chart helps your audience grasp the information quickly and clearly.
For only $0.99, you can download this slide right away and customize it in PowerPoint or Google Slides. It’s quick to edit, so you’ll be ready to share your data story in no time.
$0.99 – Purchase Checkout
Added to cart







