Communicate Processes with Circular Infographic V3
Product Description
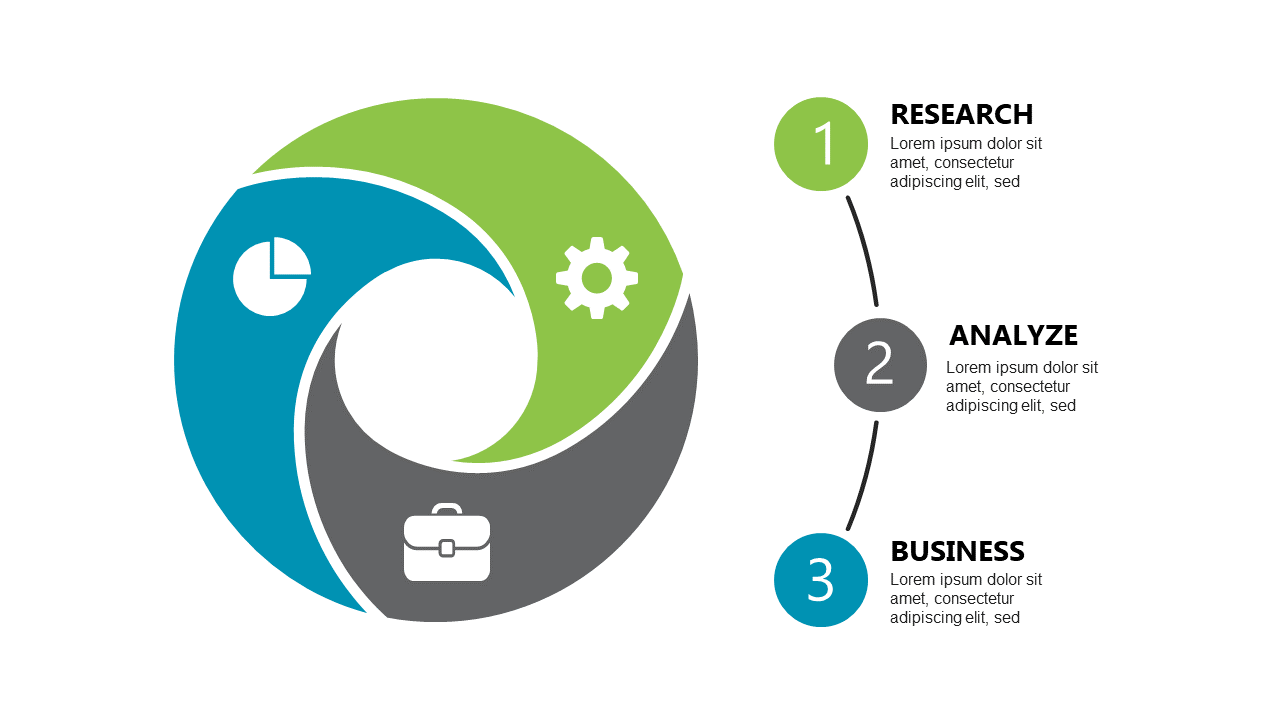
When it comes to conveying processes clearly, it can feel like an uphill battle, especially if clarity and engagement are essential. This circular infographic slide helps you break down workflows into distinct, numbered segments, each with an icon to enhance visual comprehension.
Visual designers, consultants, and educators will find this slide especially useful for workshops, client briefings, or training sessions. It allows you to present complex information in a way that’s not only clear but also memorable, ensuring your audience understands the key points.
For just $0.99, you can download this slide immediately and edit it in both PowerPoint and Google Slides. With its easy-to-use format, you’ll be ready to make your presentation shine in just minutes.
$0.99 – Purchase Checkout
Added to cart







