Present Core Concepts with Circular Process
Product Description
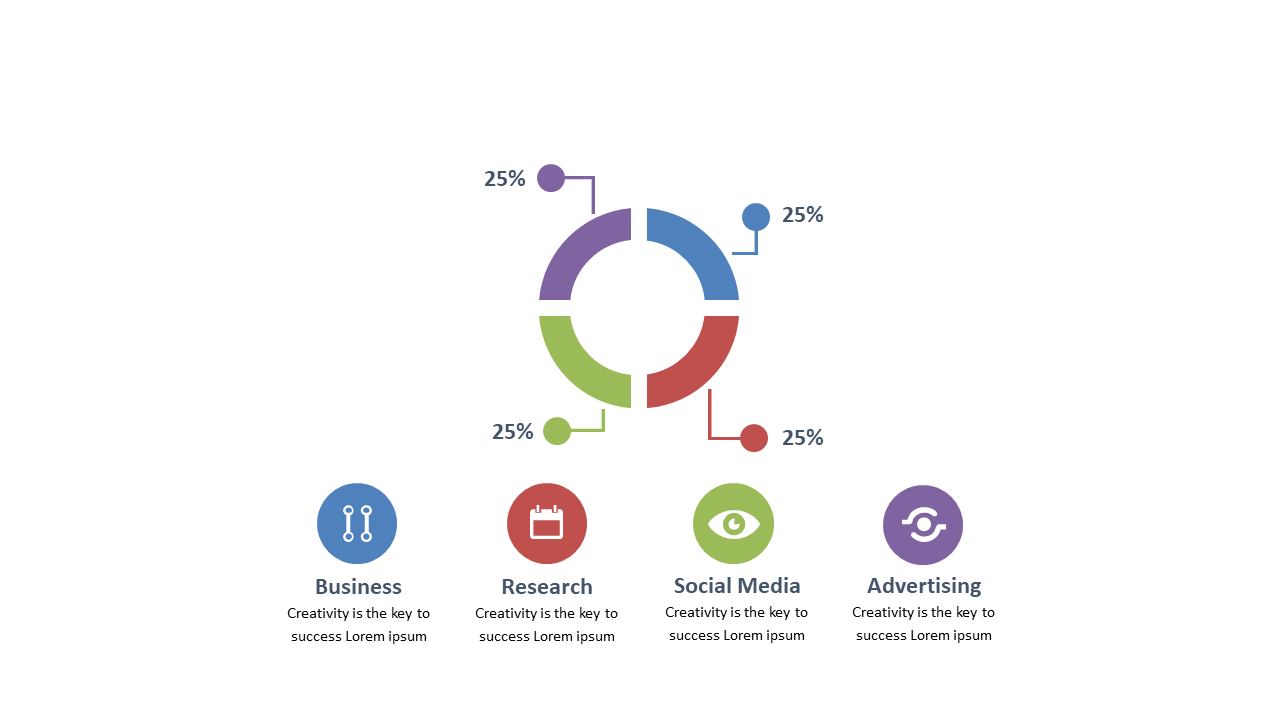
Complex ideas can often be difficult to convey, leading to misunderstandings or a lack of engagement. This slide uses a circular process layout to provide an intuitive visual representation of your core concepts, helping your audience connect the dots more easily.
Business strategists, educators, and project leaders can use this slide during workshops, training sessions, or team meetings where clear communication is essential. The engaging design, complete with relevant icons, makes it perfect for illustrating processes or frameworks.
Available for just $0.99, this slide can be downloaded immediately and is fully editable in PowerPoint or Google Slides. You’ll be prepared to present your ideas clearly and effectively in no time.
$0.99 – Purchase Checkout
Added to cart







