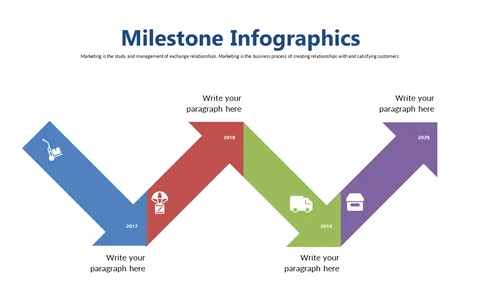
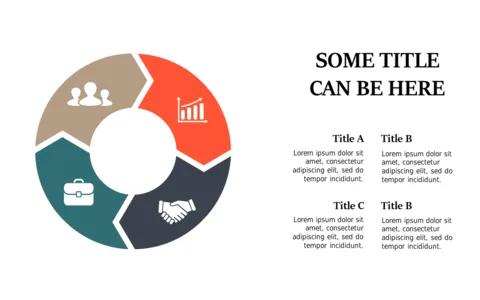
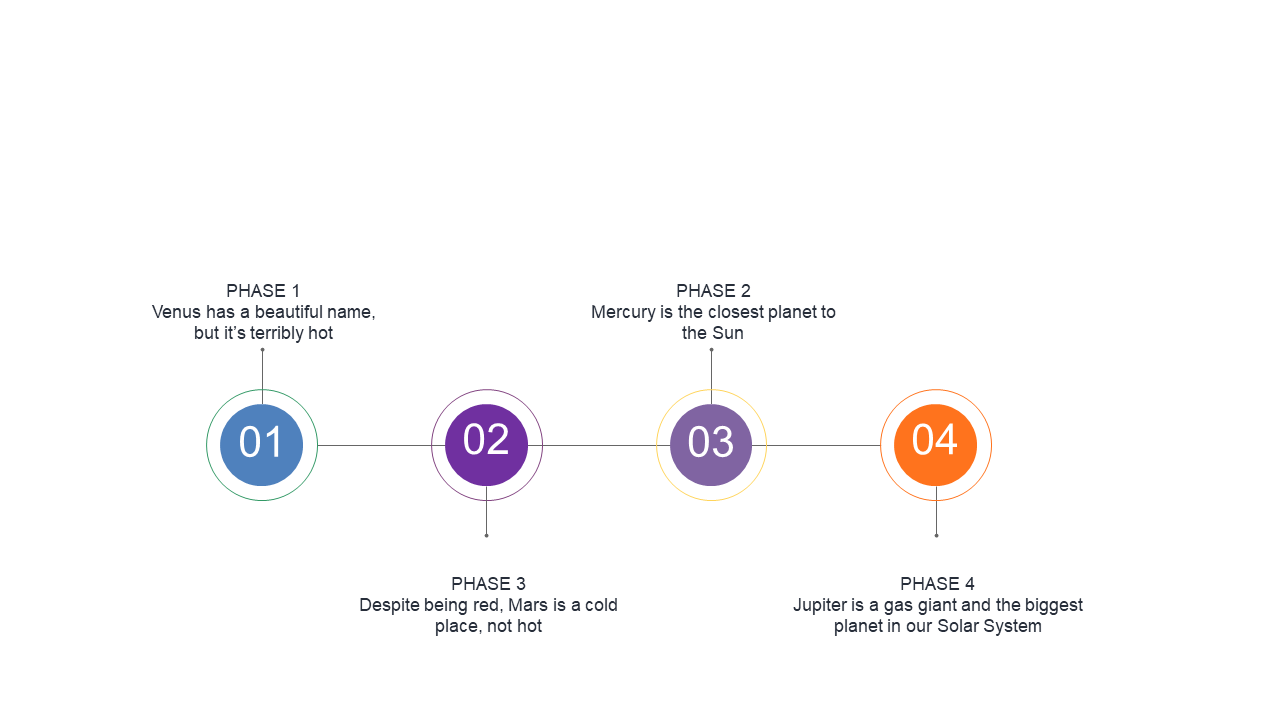
Communicate Project Phases with Circular Milestones
Product Description
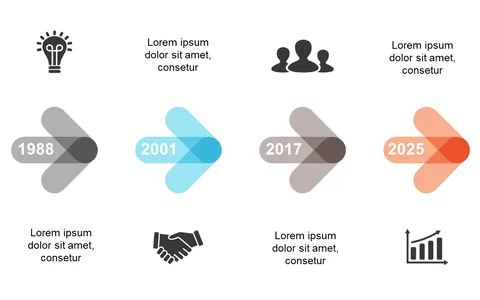
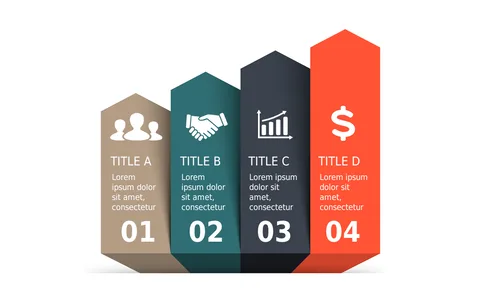
Communicating the various phases of a project can easily become overwhelming, especially if you’re relying on dense paragraphs or bullet points. This slide presents a set of circular milestones that clearly outline the project’s progression, making it easier for your audience to grasp essential information at a glance.
It’s an effective way to visualize each step without losing your audience’s interest. Operations managers, project coordinators, and team leaders in sectors like construction, software development, or marketing can use this slide to map out crucial phases during project kickoffs or weekly check-ins. It’s particularly useful during milestone reviews or when you need to update stakeholders on progress.
For just $0.99, you can download this slide immediately and customize it in PowerPoint or Google Slides. It’s straightforward to edit, allowing you to tailor the content to your project and present it with confidence.
$0.99 – Purchase Checkout
Added to cart