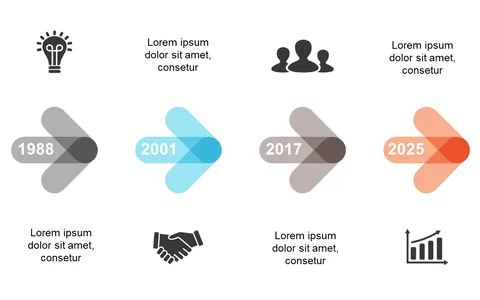
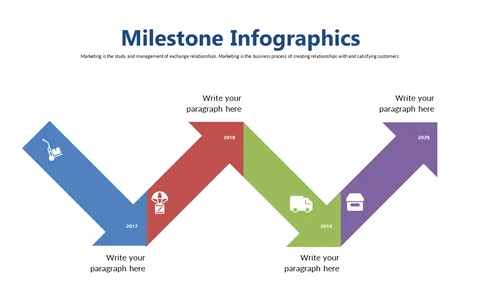
Highlight Key Metrics with Circular Milestones
Product Description
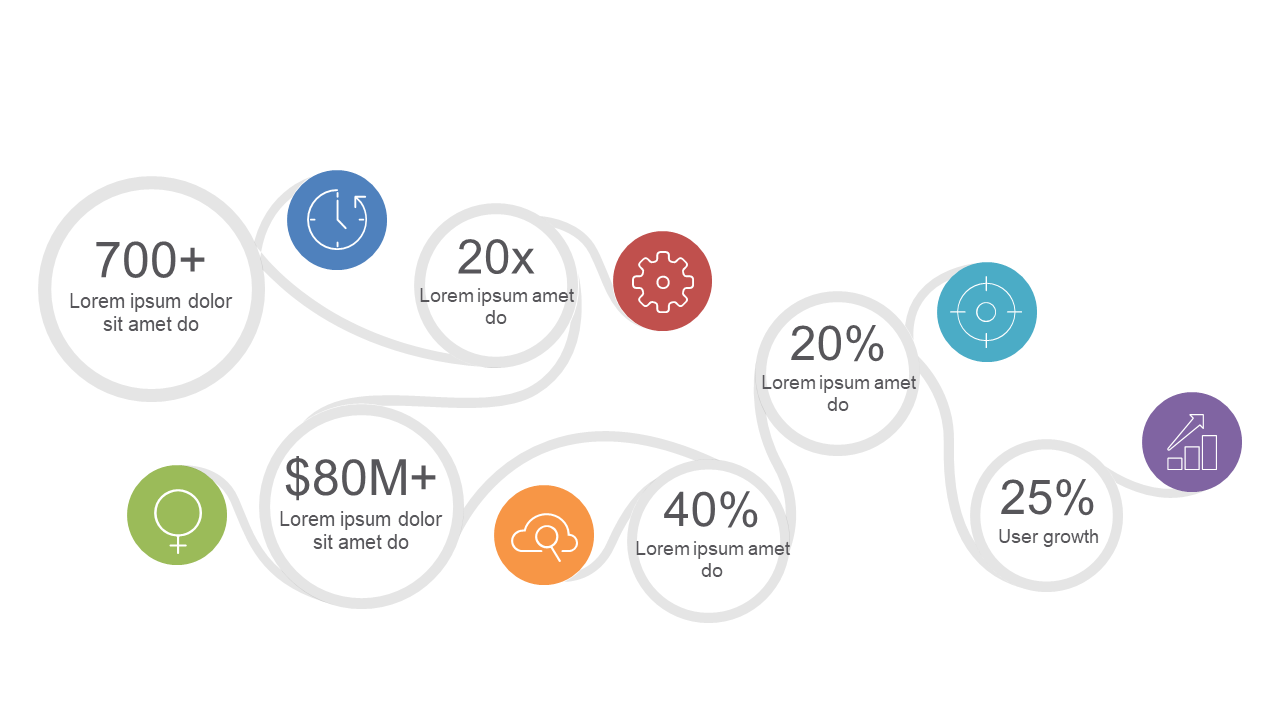
Communicating key metrics is essential for any project, yet cluttered slides often obscure crucial information. This circular milestones slide offers a refreshing design that visually links key metrics with engaging circular milestones, making your data stand out and easy to understand.
This slide fits well for project managers needing to report progress to upper management or marketing directors showcasing campaign performance metrics. It’s suitable for any scenario where highlighting important achievements and progress is necessary, helping keep your audience informed.
At just $0.99, this slide is an affordable solution that can be downloaded instantly and edited in PowerPoint or Google Slides. Customize it effortlessly to fit your metrics, ensuring you’re prepared to present key data in mere minutes.
$0.99 – Purchase Checkout
Added to cart