Visualize Project Milestones with Circular Layout

Product Description
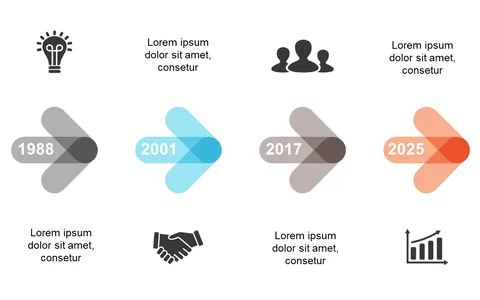
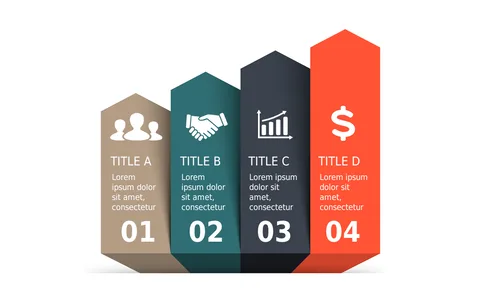
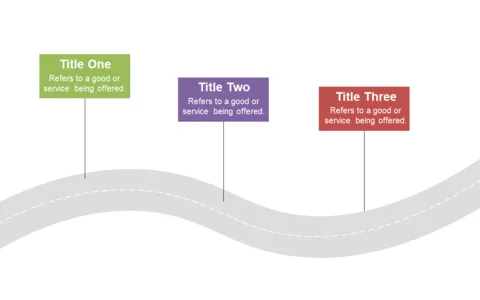
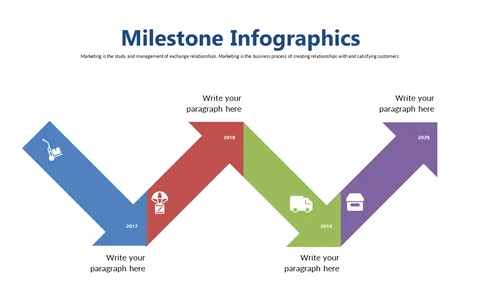
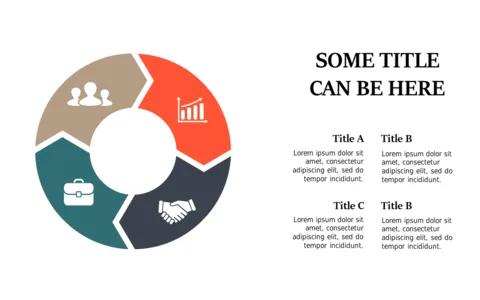
Keeping track of project milestones can sometimes feel like a juggling act. With this circular layout for visualizing milestones, you can showcase crucial steps in a progress indicator format that’s both clear and engaging. This makes it easier for your audience to see where they are in the project timeline.
This slide is perfect for project managers, event coordinators, and product owners during milestone reviews or status updates. You can use it to highlight key phases of product development, track the progress of a marketing campaign, or outline the timeline of an upcoming event.
Each segment captures attention and keeps your team focused on goals. For just $0.99, you can get this slide as an instant download and edit it easily in PowerPoint or Google Slides. It’s a quick solution that allows you to customize your project milestones and have everything ready to present in minutes.
$0.99 – Purchase Checkout
Added to cart