Present Data Visually with Circular Infographic
Product Description
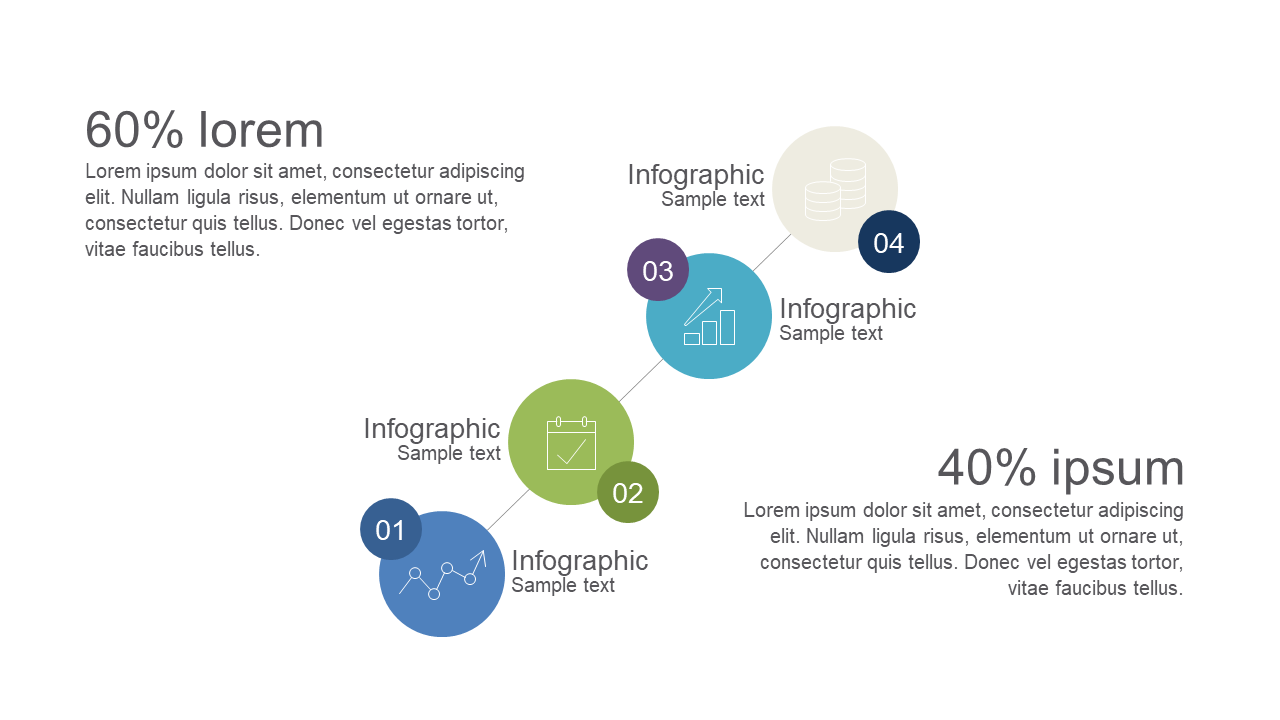
Data can easily become overwhelming, especially when you’re trying to convey critical insights to your audience. This circular infographic provides a visually appealing way to highlight key statistics and percentages, ensuring your data resonates more effectively.
Business analysts, sales professionals, and marketing strategists can use this slide during reports, client presentations, or strategy sessions. It’s a great way to showcase performance metrics, market research findings, or survey results in an engaging format.
For just $0.99, you can download this slide and start editing it right away in PowerPoint or Google Slides. Transform your data presentations into captivating visuals in no time.
$0.99 – Purchase Checkout
Added to cart







