Engaging Circular Infographic Layout for Presentations

Product Description
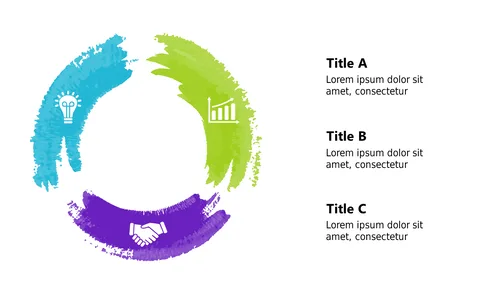
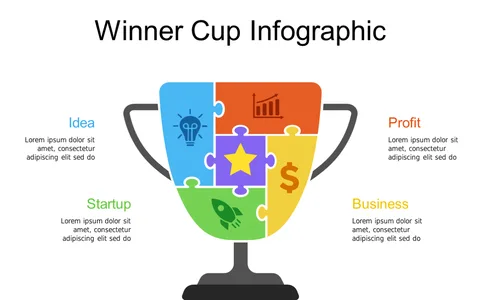
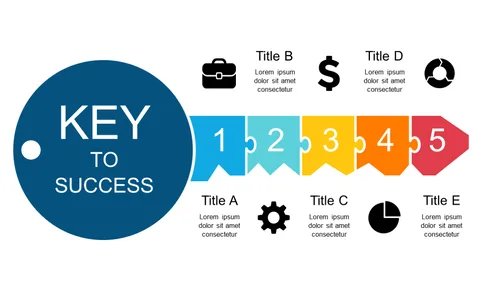
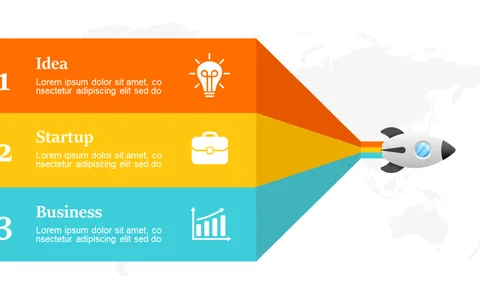
Capturing your audience’s attention during a presentation can be tough, especially when information is dense. This engaging circular infographic layout invites viewers in, using a visually appealing design that makes your central themes stand out, making complex information easier to digest.
It’s ideal for marketing specialists pitching campaign ideas, educators presenting research findings, or team leaders summarizing project updates. The circular format helps maintain focus, ensuring that your audience connects with your key messages effectively.
For just $0.99, this slide is available for instant download and is fully editable in PowerPoint and Google Slides. You can tailor it to your content easily within minutes.
$0.99 – Purchase Checkout
Added to cart