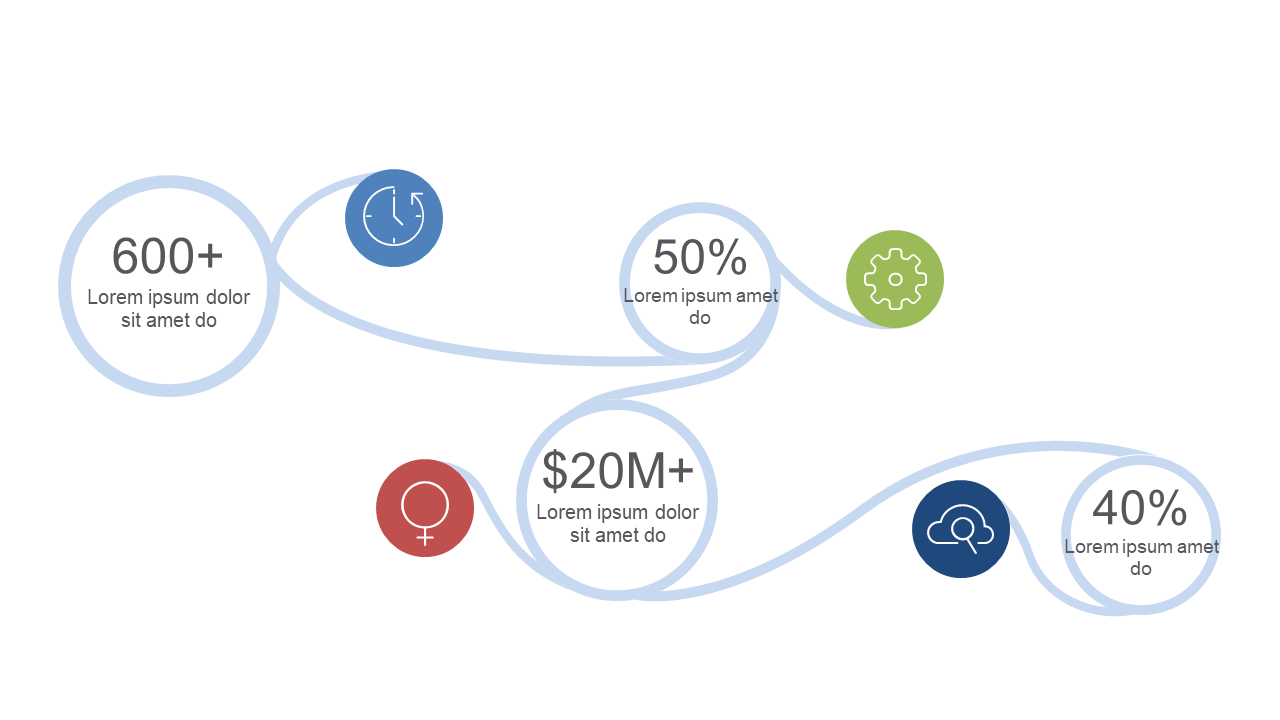
Showcase Data Points with Circular Infographic
Product Description
Presenting overwhelming data can lead to confusion rather than clarity, especially in fast-paced meetings where decisions need to be made quickly. This circular infographic simplifies the task of visualizing complex information, making it easier for your audience to digest key data points at a glance. It captures attention while ensuring that the information is presented in an understandable format.
Data analysts, financial professionals, or marketing teams will find this slide particularly valuable when presenting research findings or performance metrics. It’s perfect for quarterly reviews or client presentations where you need to quickly convey important insights without losing your audience’s interest.
Each data point is interconnected, emphasizing relationships that matter. For only $0.99, you can download this slide and start using it right away. It’s compatible with both PowerPoint and Google Slides, making it simple to edit and adapt to your presentation style.
$0.99 – Purchase Checkout
Added to cart







