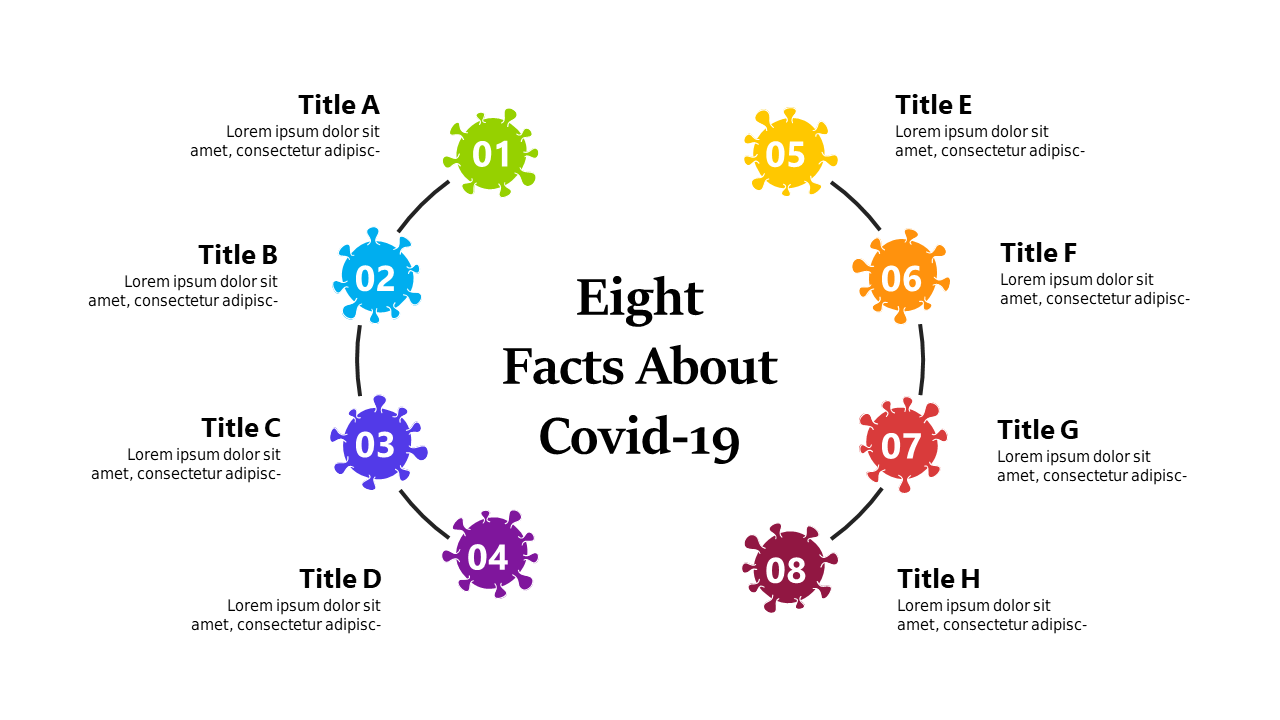
Showcase 8 COVID-19 Facts in a Circular Layout
Product Description
Delivering information about COVID-19 can feel overwhelming, especially when trying to capture attention with facts and figures. This circular infographic simplifies the process by allowing you to display eight key points in an engaging format.
It’s an effective way to present data that might otherwise get lost in dense text. Public health professionals, educators, and marketers will love how this layout can be used in various settings, like educational seminars, public health campaigns, or social media content. You can easily update the facts and icons to reflect the most current information, whether you’re addressing community groups, classrooms, or virtual audiences.
Download this slide for only $0.99, and you’ll have a customizable template ready to go in both PowerPoint and Google Slides. Editing is easy, so you’ll have your presentation looking sharp and informative in no time!
$0.99 – Purchase Checkout
Added to cart







