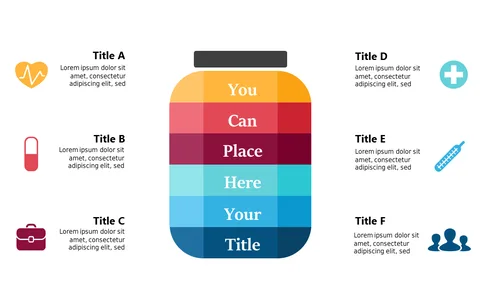
Circular Healthcare Overview for Medical Presentations

Product Description
Communicating complex healthcare information can be daunting, especially when trying to visually represent key concepts effectively. If you find it difficult to present interconnected elements clearly, this circular layout with visual icons is designed to solve that issue by illustrating relationships in an easy-to-understand manner.
This slide is perfect for healthcare professionals, educators, and researchers looking to present an overview of services, health metrics, or educational content in conferences, seminars, or training sessions. It helps clarify your messaging and visualizes important connections in a way that resonates with your audience.
At only $0.99, this slide can be downloaded instantly and edited to fit your specific needs. It works well in both PowerPoint and Google Slides, making customization straightforward and quick so you can focus on delivering your message.
$0.99 – Purchase Checkout
Added to cart