Showcase Key Data Points Visually
Product Description
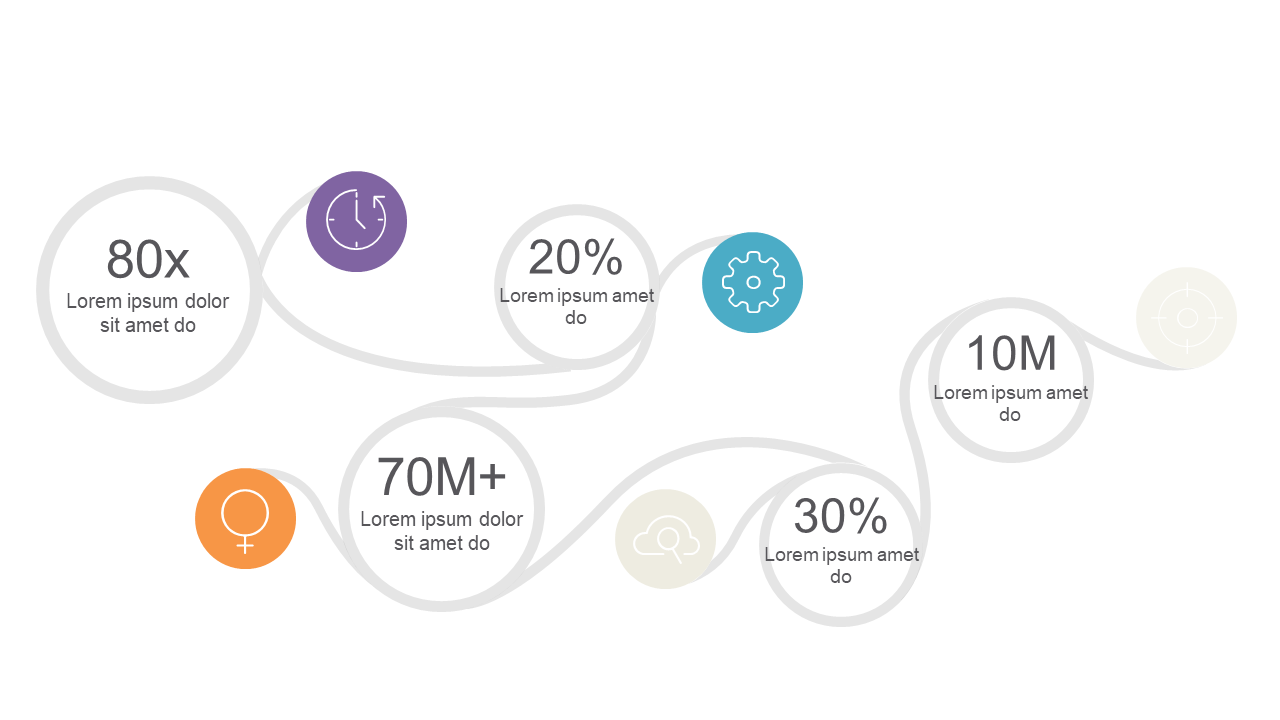
When you’re under pressure to convey critical information, clarity is essential to ensure your audience understands the message. This slide transforms complex data sets into a visually engaging format, allowing you to showcase key statistics effectively. The interconnected circular data points create a clear visual narrative that captures attention.
You can use this slide in a variety of contexts, whether you’re a financial analyst presenting quarterly results, a marketing manager sharing campaign performance, or a project manager reviewing KPIs. It’s designed to make complex information accessible and engaging for any audience, making your data tell a compelling story.
For only $0.99, this slide is ready for instant download. It’s fully editable in both PowerPoint and Google Slides, allowing you to quickly adjust it to suit your presentation. Communicate your vital data clearly and effectively!
$0.99 – Purchase Checkout
Added to cart







