Visualize Ideas with Circular Center and Branching Bubbles
Product Description
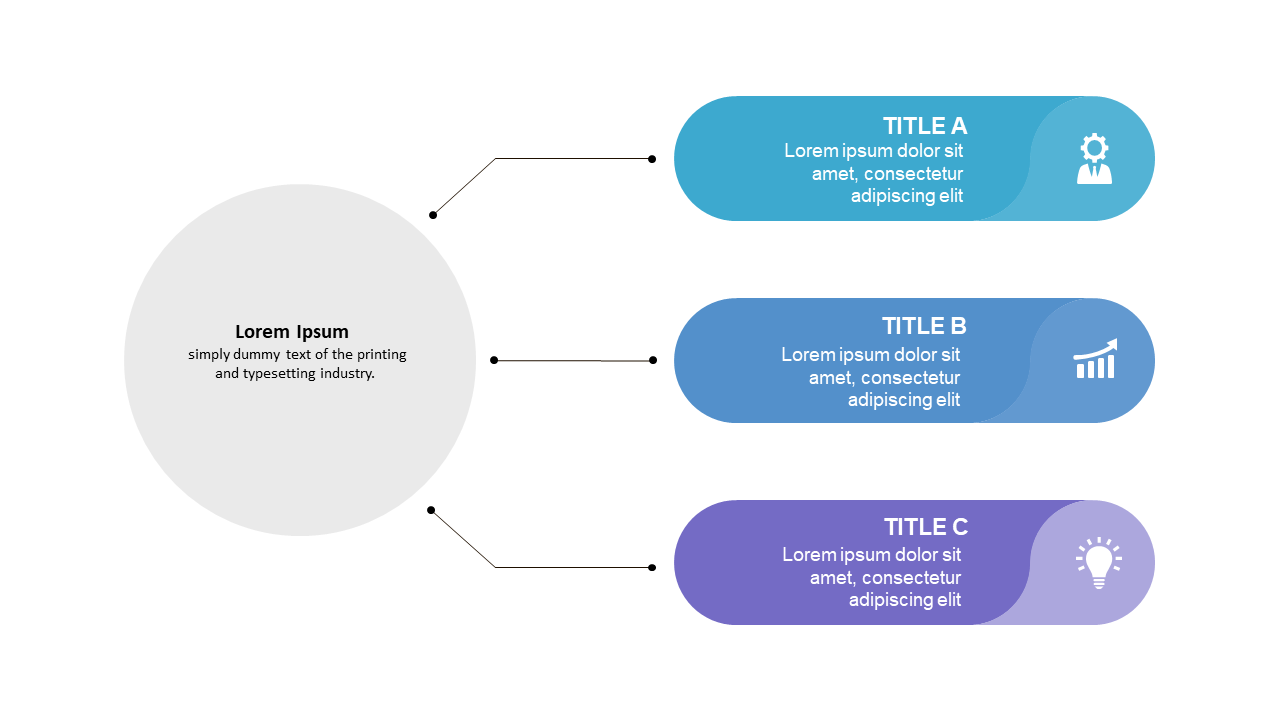
Finding a way to illustrate interconnected concepts can feel impossible, especially when trying to get everyone on the same page. A cluttered slide can confuse your audience instead of clarifying your ideas. This slide, featuring a central circle with branching bubbles, makes it easy to visualize relationships and connections among your thoughts, simplifying the storytelling process.
This is a great choice for content strategists presenting idea maps or project managers outlining project components. It works well in brainstorming sessions, strategic planning meetings, or any scenario where you need to illustrate complex relationships clearly.
Your audience will appreciate the straightforward design that enhances understanding. Available for just $0.99, this slide can be downloaded instantly, and it’s fully editable in PowerPoint and Google Slides. You’ll have it customized and ready for your presentation in no time, making it a valuable asset for your next meeting.
$0.99 – Purchase Checkout
Added to cart







