Highlight Pricing Strategies with Circular Infographic V2
Product Description
Losing your audience in the details of your pricing strategies is a common pitfall. When complex concepts aren’t presented clearly, you risk diluting the value of your offering.
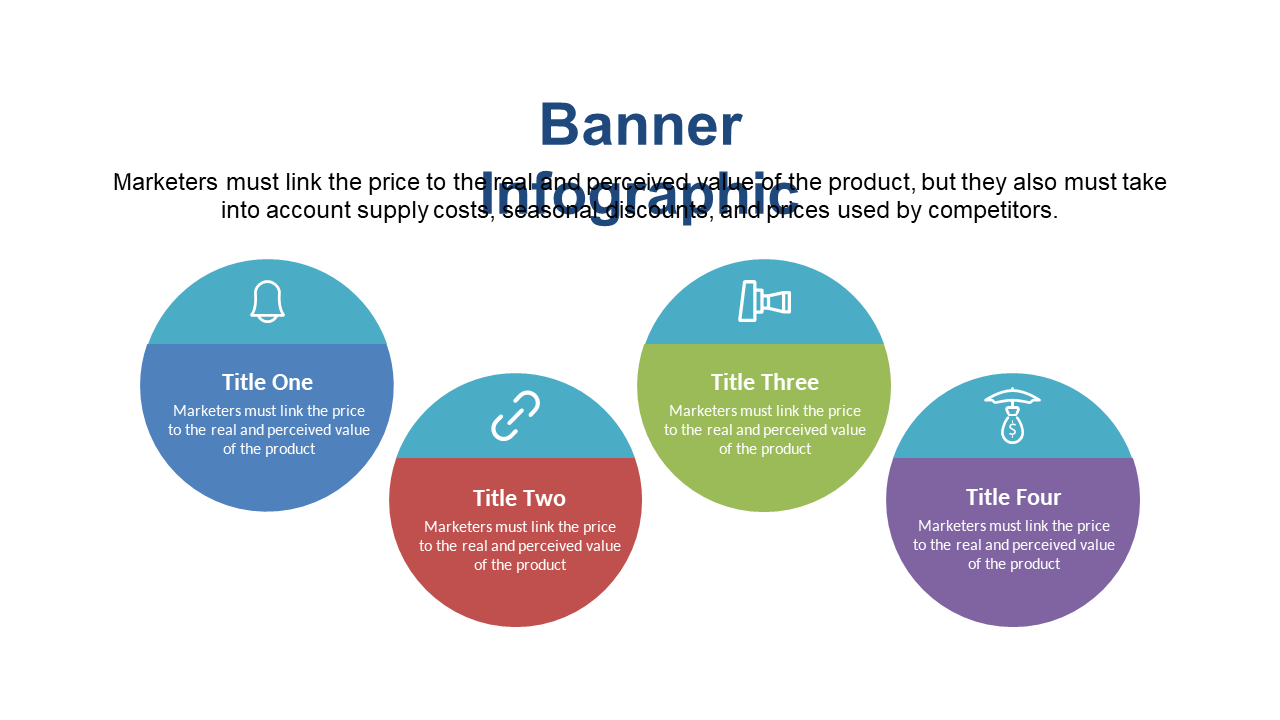
This circular infographic transforms your data into a visually engaging format that highlights key insights effortlessly. This slide is ideal for product managers explaining pricing models in quarterly business reviews or for marketing teams creating compelling sales presentations. It also proves useful for consultants who need to lay out pricing strategies for clients in an easily digestible way.
For just $0.99, you can enhance your presentations instantly. It’s a quick download, and you can edit it easily in PowerPoint or Google Slides to fit your unique message.
$0.99 – Purchase Checkout
Added to cart







