Showcase Processes with an 8-Step Circular Infographic
Product Description
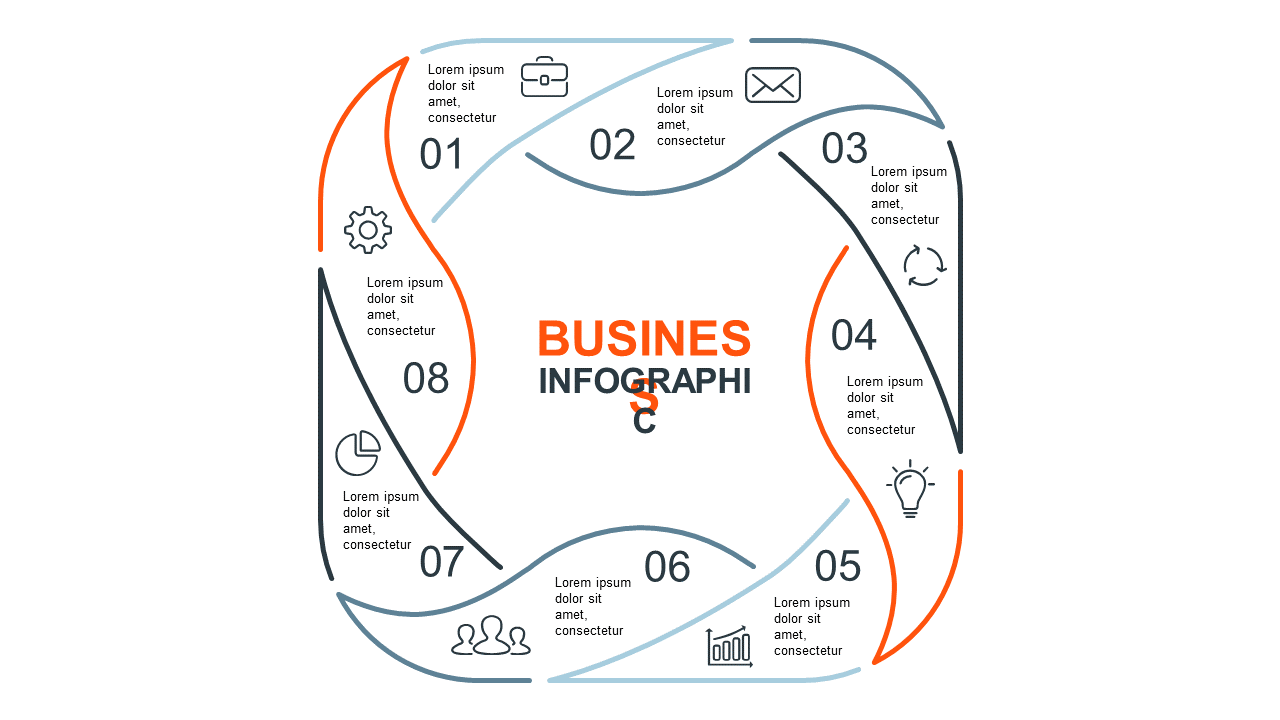
When presenting intricate processes, clarity and engagement are key to keeping your audience focused. An 8-step circular infographic helps to break down complex information into digestible parts, making your message accessible and memorable.
This layout is perfect for marketing strategists outlining campaign steps, healthcare professionals explaining patient care processes, or operations analysts detailing workflows. It can serve as a vital tool in any setting where you need to present multi-step processes clearly.
For just $0.99, you can download this slide and immediately start making changes to fit your presentation. It works in both PowerPoint and Google Slides, so you can create a professional-looking slide in minutes.
$0.99 – Purchase Checkout
Added to cart







