Illustrate Stages of a Process with Circle Infographics
Product Description
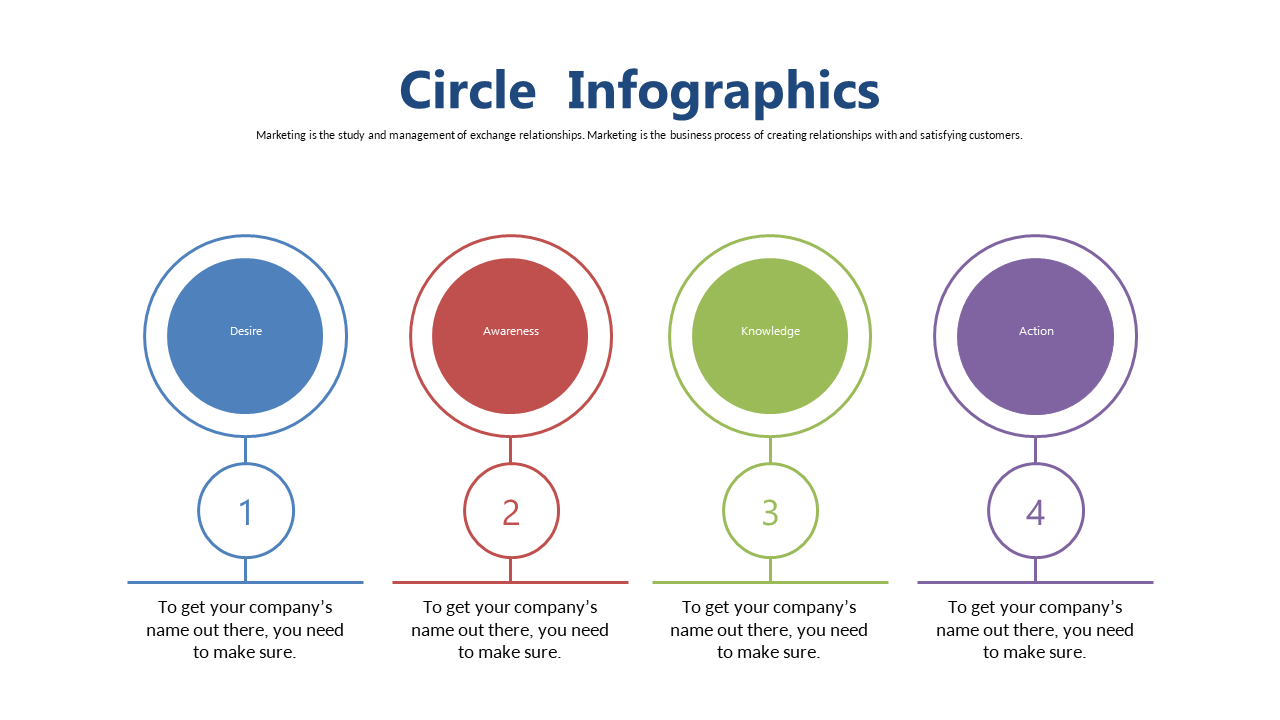
Explaining the steps in any process can often lead to misunderstandings if visual aids are unclear. This slide makes it easy to depict each phase with four distinct circles, allowing your audience to see the progression without losing sight of the bigger picture.
Project managers outlining workflow stages, operations specialists discussing production phases, or educators teaching complex concepts will appreciate how this slide enhances their presentations.
It’s ideal for team meetings, training sessions, or any scenario where clear process representation is necessary. At just $0.99, this infographic slide is available for immediate download, and it’s fully editable in PowerPoint and Google Slides, giving you the freedom to tailor it to your specific content.
$0.99 – Purchase Checkout
Added to cart







