Charts and Graphs PowerPoint Templates
Product Description
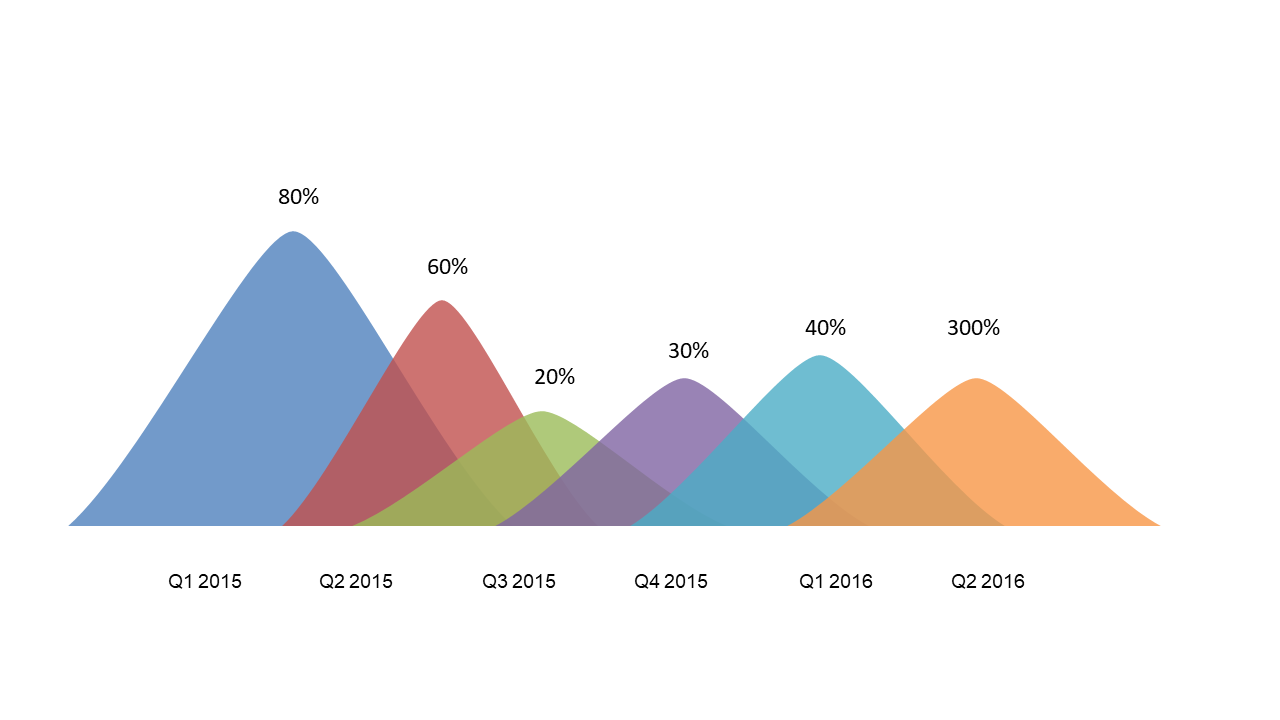
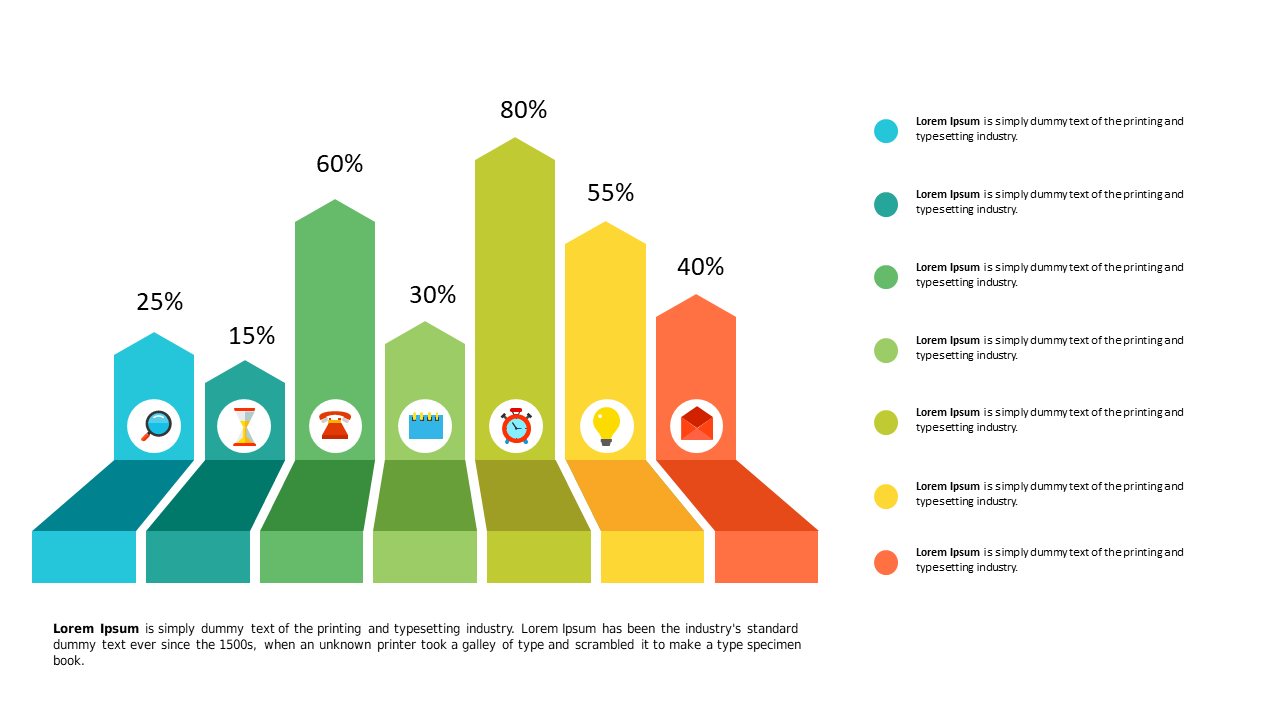
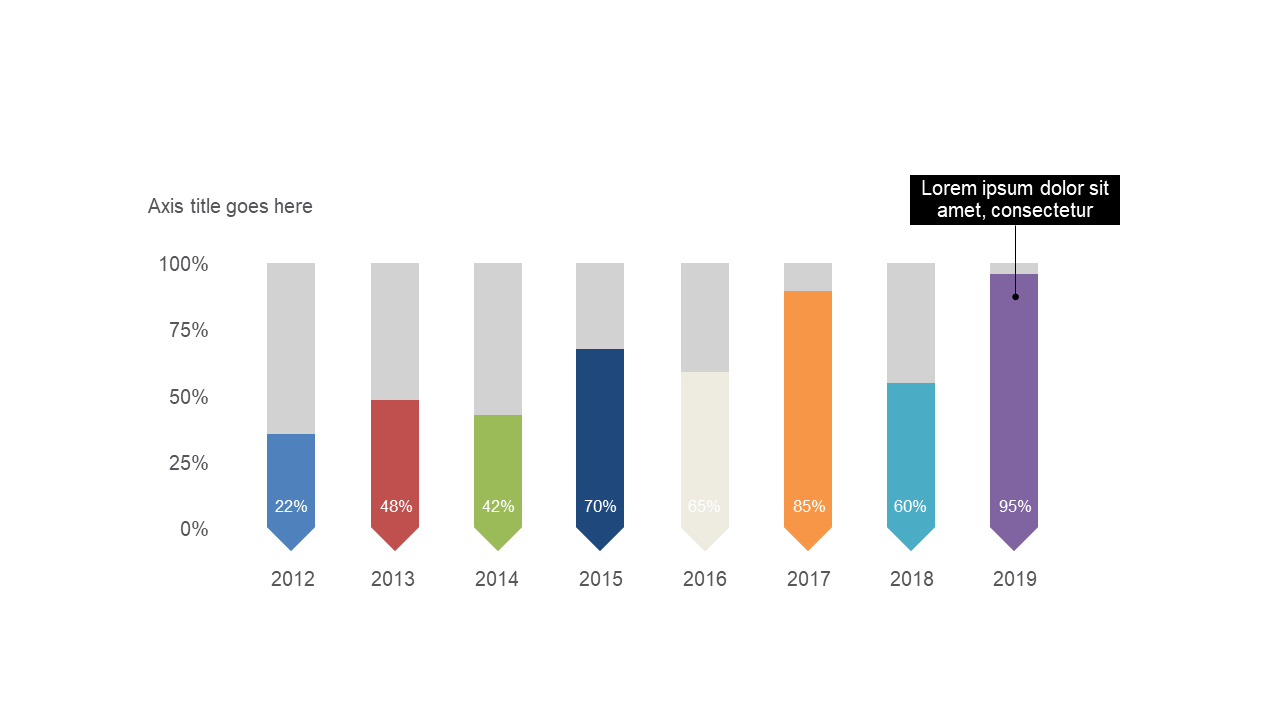
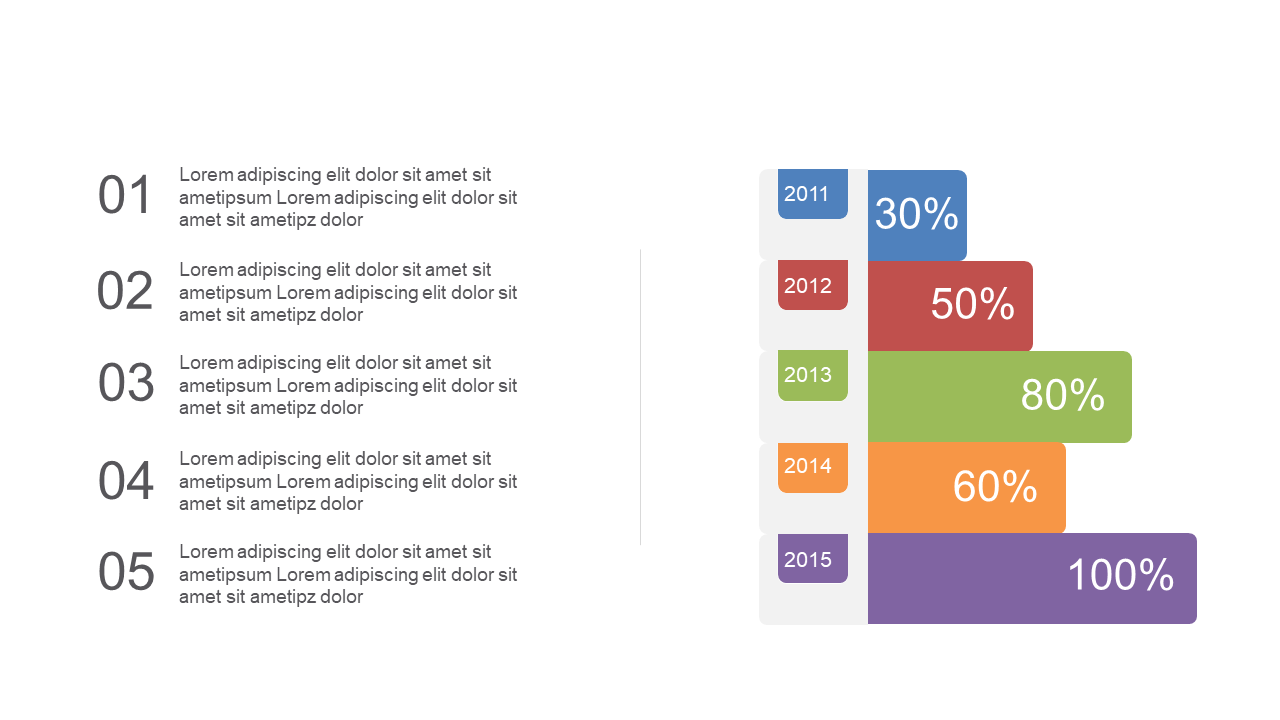
Visualizing data shouldn’t feel like a chore, but often it can be a challenge to present complex information clearly. You want your audience to grasp key metrics quickly, without getting lost in a sea of numbers or cluttered visuals. This is where a clean, professional design makes all the difference, ensuring that your charts and graphs speak for themselves.
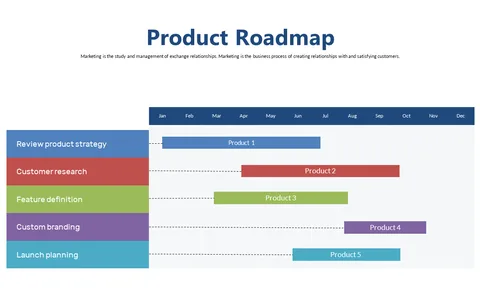
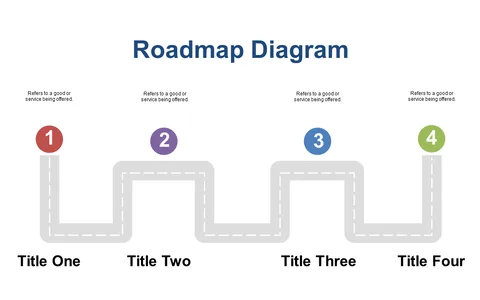
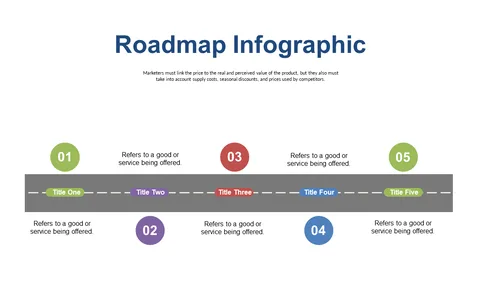
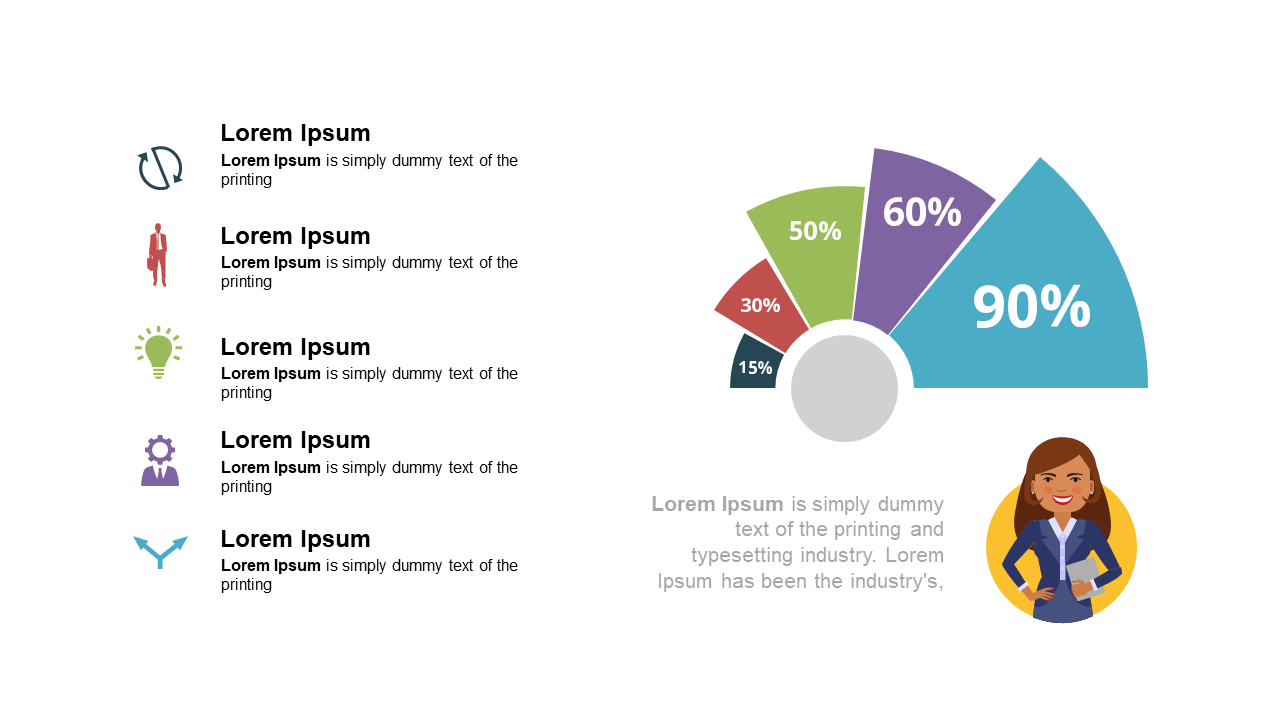
Whether you’re a financial analyst presenting quarterly results, a marketing professional showcasing campaign performance, or a project manager discussing timelines with your team, this template meets your needs. It’s perfect for board meetings, client pitches, or internal strategy sessions where making an impact with data is essential. The variety of slide types, including infographics and Gantt charts, allows you to tailor your presentation to any scenario.
When you download this template, you’ll get 20 ready-to-edit slides that are not only visually appealing but also easy to customize. Simply plug in your data, adjust colors if needed, and you’re set to impress— all for just $3.99. In minutes, you can create a polished presentation that looks professional whether you’re sharing it in-person or over Zoom.
🛡 7-Day Money-Back Guarantee