Showcase Growth Comparison with a Building Infographic
Product Description
When it comes to presenting growth comparisons, numbers alone can often leave your audience confused or disengaged. You need a way to simplify complex data so that your audience can quickly grasp the key points.
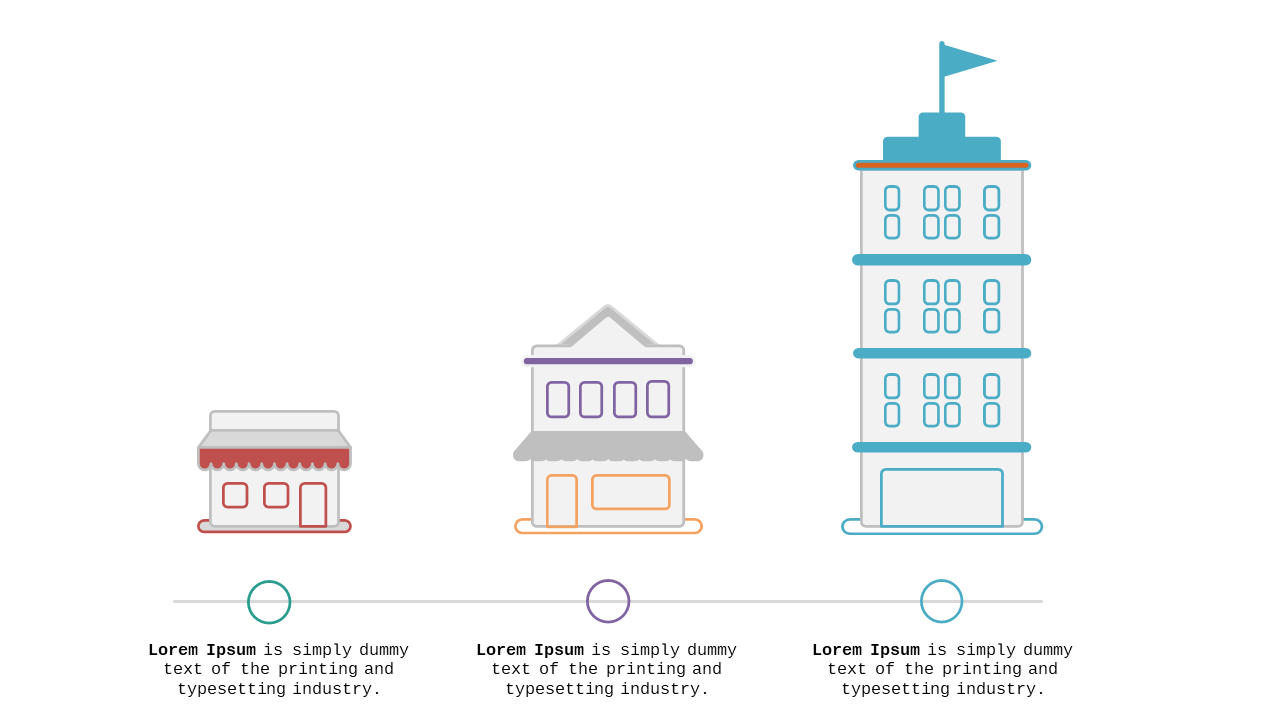
This slide offers a striking infographic design using building images to effectively illustrate different growth stages. Business analysts, marketing specialists, and project managers across various sectors will find this slide invaluable for quarterly reports, strategy meetings, or client presentations. It’s perfect for anyone who needs to convey performance metrics in a visually engaging manner, making the data relatable and easy to digest.
At just $0.99, this slide is available for immediate download and can be easily customized in PowerPoint or Google Slides. You’ll have a polished, informative slide ready to go in no time.
$0.99 – Purchase Checkout
Added to cart







