Visualize Audience Engagement with Infographic
Product Description
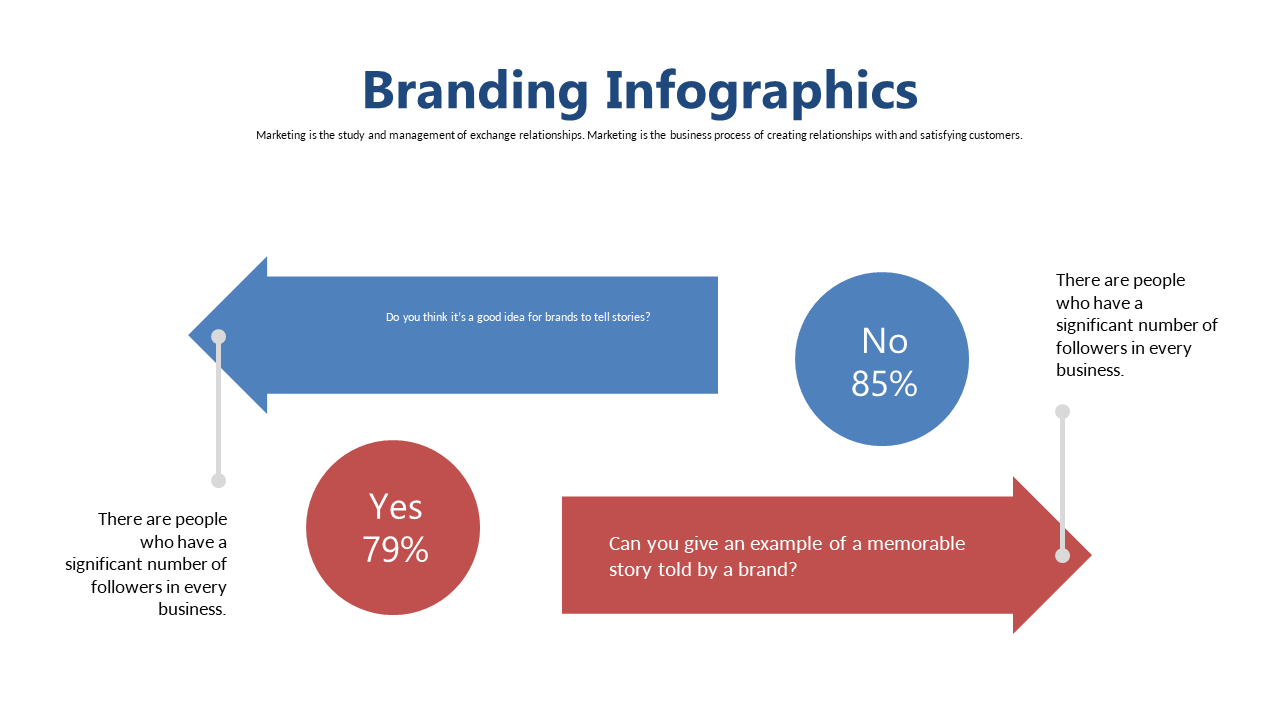
Understanding audience engagement can be tricky, especially when it comes to presenting insights visually. This infographic slide uses dynamic arrows and statistical visuals to clearly convey how your audience interacts with your content and their sentiments.
It transforms complex data into accessible visuals that resonate with viewers. This slide is perfect for social media managers, content marketers, and UX researchers who need to report on audience behavior and engagement during team meetings or client presentations. By visualizing these insights, you can guide discussions about content strategies and audience targeting effectively.
For only $0.99, you can download this slide immediately, and it’s fully editable in both PowerPoint and Google Slides. Customizing it to suit your data is quick and straightforward, allowing you to focus on what matters most—delivering powerful insights.
$0.99 – Purchase Checkout
Added to cart







