Dynamic Battery Infographic for Metrics Presentation
Product Description
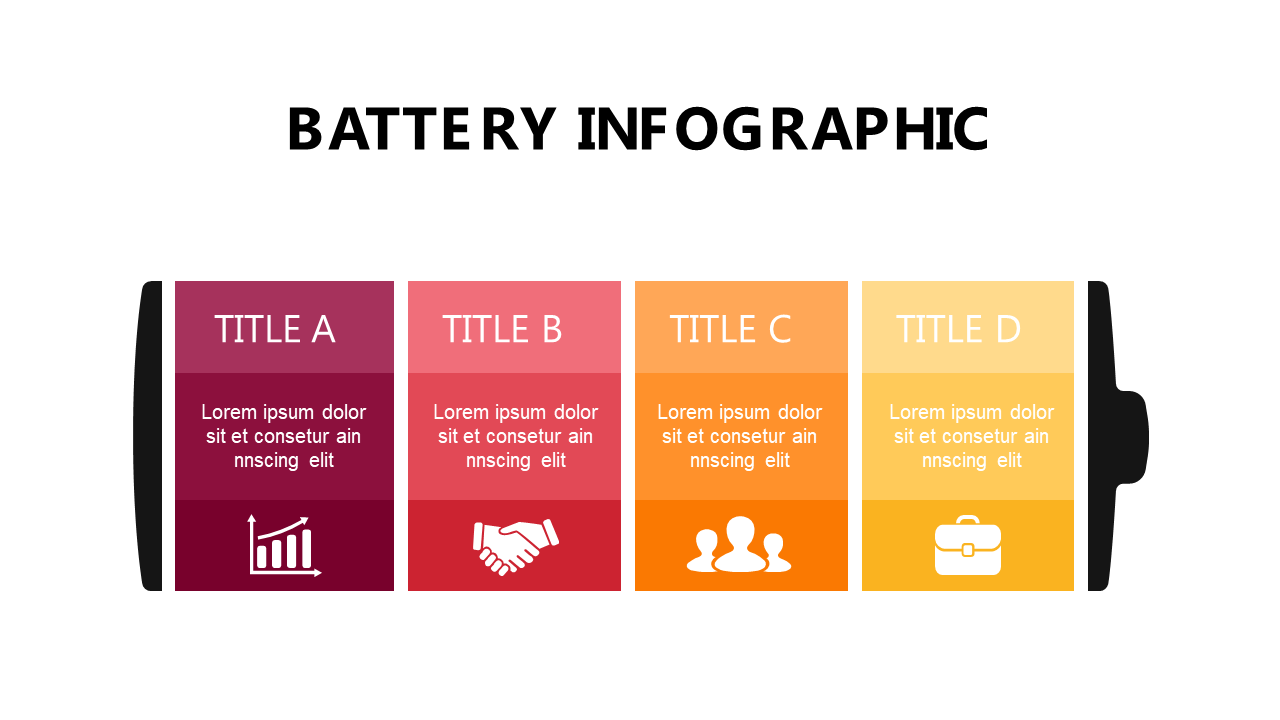
When it comes to presenting multiple metrics, clarity is essential to avoid overwhelming your audience. This dynamic battery infographic offers an eye-catching way to display various data points, making complex information more digestible.
This slide is perfect for data analysts presenting reports, finance teams reviewing quarterly metrics, or marketing managers sharing campaign performance. Any time you need to communicate multiple figures or results at once, this template will come in handy.
For just $0.99, you can instantly download this infographic and adapt it to your presentation needs. It’s editable in both PowerPoint and Google Slides, allowing for quick modifications so you can impress your audience in no time.
$0.99 – Purchase Checkout
Added to cart







