Showcase Product Pricing with Visual Icons
Product Description
In a fast-paced market, effectively presenting product pricing can be a daunting task. Without the right tools, conveying value can easily become confusing for your audience.
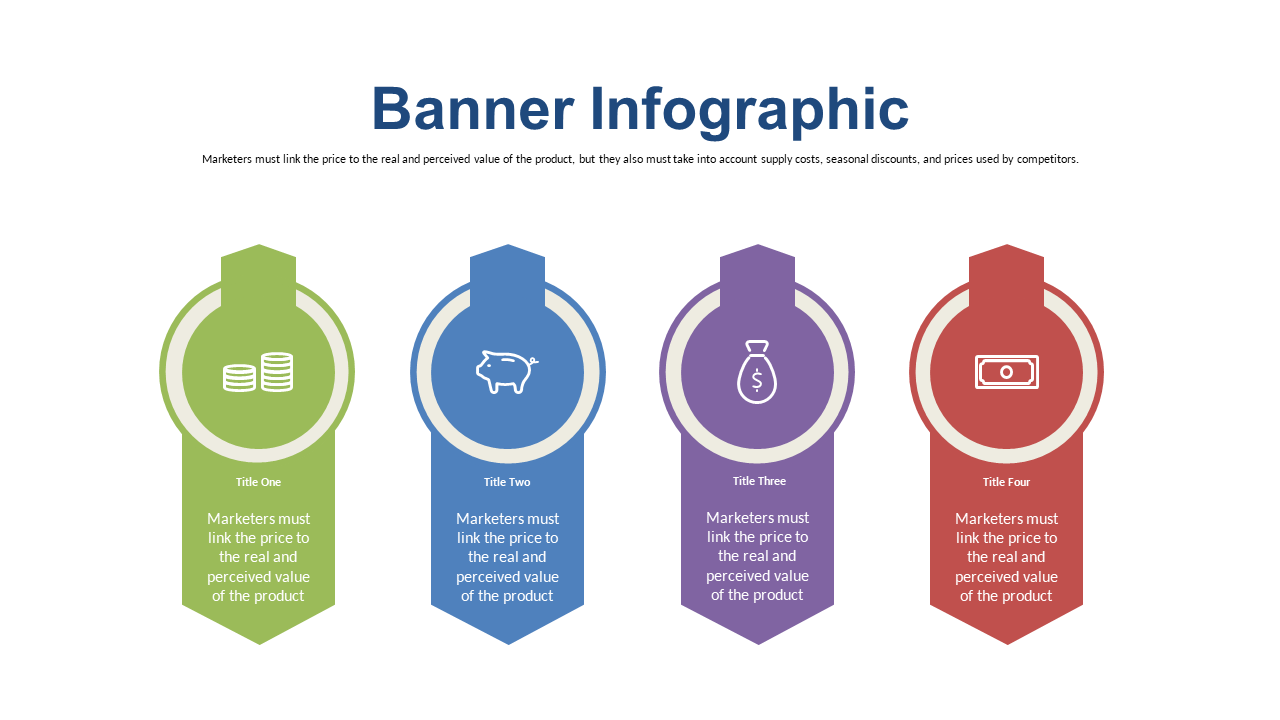
This infographic slide simplifies that challenge by showcasing pricing information in a clean layout with visual icons that enhance understanding. It’s ideal for product managers during launch presentations, marketers discussing pricing strategies, or business analysts analyzing market trends. This slide can help you clearly communicate your pricing structure and make your value proposition more compelling.
Available for just $0.99, you can instantly download this slide and tweak it in PowerPoint or Google Slides. Get everything set up in minutes to ensure your pricing information resonates with your audience.
$0.99 – Purchase Checkout
Added to cart







