Engage Audience with Multiple Sections Infographic
Product Description
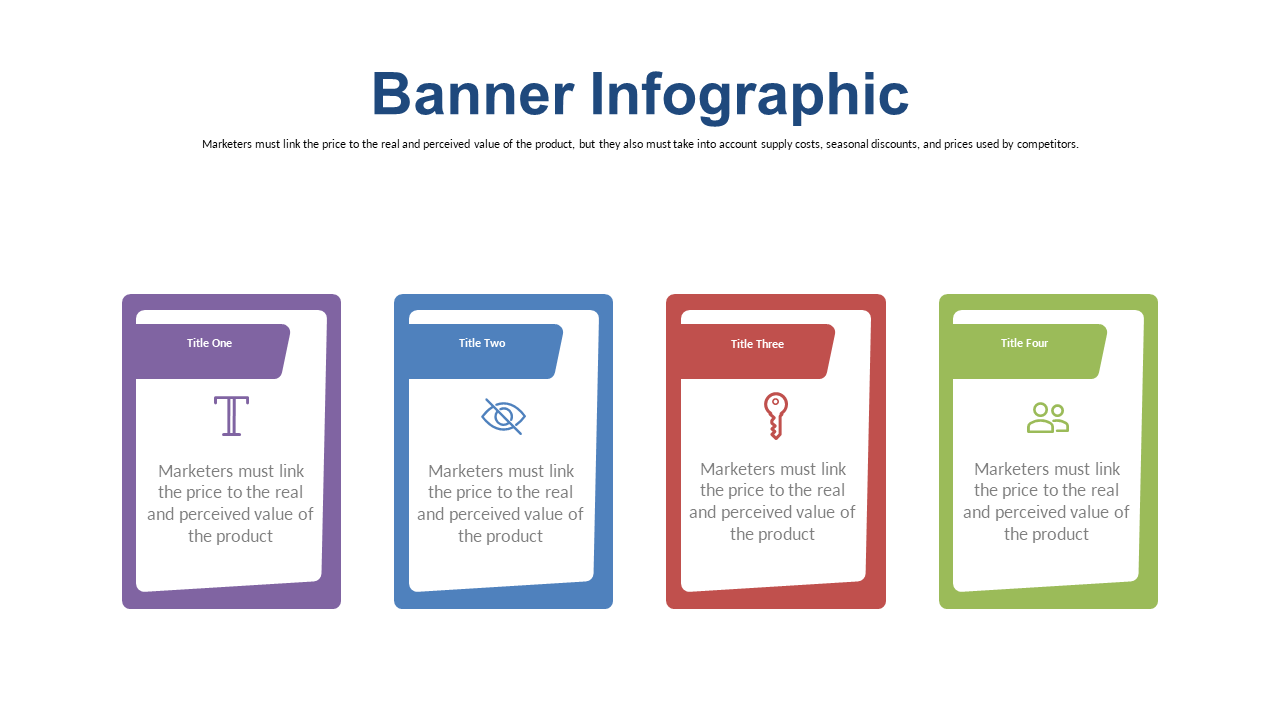
Engaging your audience can feel like an uphill battle, especially when you’re faced with complex data that needs clarity. When your slides fall short on impact, it’s easy for attention to drift, leaving you to scramble for engagement. This infographic slide breaks down information into multiple sections, ensuring your message is not just heard, but fully understood.
This slide is perfect for educators delivering lectures, project managers sharing updates, or sales professionals giving product demos. Whether you’re presenting at a team meeting, a conference, or a client briefing, this slide will help you convey your points effectively. Don’t let your hard work go unnoticed; use this infographic to keep your audience engaged and informed.
For just $0.99, you can download this slide instantly and start making it your own. It’s fully editable in PowerPoint and Google Slides, so
you can customize it to fit your content and style in just minutes.
$0.99 – Purchase Checkout
Added to cart







